


Abstract
Diagnosing and managing pulmonary disease usually requires judging lung function against predicted values. We explored patient survival data to help identify the best equations for our population.
The earliest spirometry, lung volumes and gas transfer data for all Caucasian patients were extracted from our database. Survival status was available for 8,139 patients. Lung function as standardised residuals (SR) from various prediction equations was used in Cox regression to predict the hazard ratio (HR) for death.
The best lung function predictor of all-cause mortality was diffusing capacity of the lung for carbon monoxide (DL,CO), followed by forced vital capacity (FVC). These were best with the equations of Miller, derived from a US population, with Chi-squared values of 1,468 and 1,043 for DL,CO and FVC, respectively, having taken age, sex, smoking status and body mass index into account. The HR (95% CI) for SR < -3 were 8.5 (6.0–12.1) and 2.9 (2.3–3.5), respectively. Spirometric equation prediction models varied less than those for DL,CO, with the Miller equations being slightly better than Lambda-Mu-Sigma (LMS) equations. Some DL,CO equations introduced sex bias (male sex HR of 3.0 versus 1.5 for other equations).
We conclude that LMS or Miller spirometry equations and Miller’s DL,CO equations were best for our patient population. Using patient survival data is a new approach to help select which lung function prediction equations to use.
Managing clinical cases with pulmonary disease very often requires an assessment of whether a patient’s lung function is acceptable or not. Since the earliest recordings of spirometric lung function in the mid-1800s, it was noted that the results depended on a number of the individual’s characteristics, such as sex, age, height [1] and work [2]. Nowadays, it is customary to use prediction equations for lung function derived from studies on subjects deemed to be normal and essentially free of disease, to determine whether a patient has results within accepted normal limits [3, 4]. There are a number of issues in this practice that can adversely affect the deductions drawn about an individual patient, of which the first is the choice of which prediction equation to use for a given patient.
The studies undertaken to derive the prediction equations should ideally use similar equipment and methods for their measurements to those used for the patients under consideration, and the population of normal people used should be appropriately matched. The American Thoracic Society (ATS)/European Respiratory Society (ERS) standardisation documents have gone a long way to ensure that methods for making the measurements are reliable [5, 6]. Finding prediction equations that used an exact match for equipment can be difficult as technology improves. Generating new equations for new equipment is expensive, since large surveys need to be undertaken. Matching the populations must obviously take ethnicity into account, since this is known to affect lung function [4]. Equations derived from subjects studied 30 yrs ago might be considered inappropriate, since today’s patients are from a different cohort with potentially different growth trajectories, but recent evidence suggests this is not necessarily the case [7].
We recently encountered difficulties in the interpretation of a study because the prediction equations used clearly did not best suit our subjects, so we used survival data for our patients who had been tested in the University Hospital Birmingham NHS Trust lung function laboratory (Birmingham, UK) to see if this could help determine which set of equations was best for predicting survival and so was a best fit for our patients.
METHODS
We extracted all the lung function data from our database, which had been first set up in December 1996. All measurements were made using Association of Respiratory Technicians and Physiologists (ARTP) standards [8], which are largely based around the 1993 ERS standards [4]. Spirometry was recorded using a Vitalograph wedge bellows spirometer (Vitalograph, Buckingham, UK) and then, more recently, using a Jaeger pneumotachograph (Erich Jaeger, Hoechberg, Germany). Gas transfer was measured using a Morgan Model C (Morgan Medical, Chatham, UK) or by a Jaeger Masterscreen system. Quality control followed accepted guidelines, with calibration prior to each recording session and weekly biological control testing. There were 24,605 data records. From these, we obtained the first recorded full set of data, which included forced vital capacity (FVC), forced expiratory volume in 1 s (FEV1), total lung capacity (TLC), residual volume (RV), single-breath diffusing capacity of the lung for carbon monoxide (DL,CO) and transfer coefficient of the lung for carbon monoxide (KCO; defined as DL,CO/alveolar volume). The ratio of FEV1/FVC was calculated (FEV1R). Data for the 2,123 non-Caucasian patients were excluded, since the number was too low to explore the validity of ethnicity correction factors.
This gave data on 8,340 individual subjects. We found a match from their National Health Service (NHS) number, name, sex and date of birth on the NHS central database for 8,139 of these, and discovered whether they were still alive on March 5, 2011. Survival was calculated as elapsed time from the date of the first test to the date of death or March 5, 2011 if still alive. The mean±sd age of the 201 subjects not matched on the NHS database was 58.2±15.6 yrs, which was not different from those with a match but the sex distribution included slightly more females (51% female versus 47% in those matched), which might relate to change of name on marriage. We then applied different prediction equations to the 8,139 subjects with survival data, to calculate each index as standardised residuals (SR) where the SR value is given by SR=(observed value – predicted value)/RSD, where RSD is the residual standard deviation for the equation used [4]. We chose to test equations that are used commonly in Europe and the USA, as well as some published relatively recently. For spirometry, we applied the equations from the European Community for Steel and Coal (ECSC) [4], Knudson et al. [9], Roberts et al. [10], the Lambda-Mu-Sigma (LMS) equations [11, 12], Miller et al. [13], the third National Health and Nutrition Examination Survey (NHANES III) [14], Crapo et al. [15] and Kuster et al. [16]; for gas transfer we used the equations from the ECSC [4], Roberts et al. [10], Miller et al. [17], Crapo and Morris [18], and Cotes and Hall [19]. The LMS equations differ from most others in taking into account all ages from 4 to 80 yrs and allowing for the variation in spread of normal data with age. The relationship of lung function to age and height in the LMS and Kuster equations are power functions.
Each lung function index was divided into 10 groups according to the SR values in table 1. These groupings were chosen as they can test how the different prediction equations pitch our patient data with regard to a normal distribution. We also standardised FVC, FEV1 and DL,CO by dividing by the cube of height, as powered standardisation of spirometric indices has previously been shown to improve survival prediction [20]. Deciles of age and the height-standardised indices were derived. Smoking status was classified as never smoked, ex-smoker or current smoker.
Cox proportional hazard regression models were derived for predicting hazard ratios (HR) for all-cause mortality using IBM SPSS version 19 (SPSS Inc., Chicago, IL, USA) with all data entered as categorical variables. The validity of the assumption of proportional hazard was acceptable for all models.
RESULTS
Of the 8,139 subjects, 52.6% were male, 31.5% had never smoked, 49.4% were ex-smokers and 19.2% were current smokers. Just over 25% of our patients were aged >70 yrs. The demographics and survival for each sex are shown in table 2 with mean±sd for lung function data expressed as SR for each sex using the ECSC equations. The suggested (unconfirmed) diagnoses on the lung function request forms were 14.7% chronic obstructive pulmonary disease, 9.3% asthma, 7.7% pulmonary fibrosis and 68.3% unclear, with a mortality of 26%, 26%, 30% and 27% respectively for these diagnoses and 27% for all the subjects overall (2,209 deaths, 61.6% male, male/female ratio 1.60). The correlations between the indices were all significantly different from zero due to the large size of the dataset, but taking a threshold Spearman correlation coefficient of 0.4 as potentially meaningful (16% of variance explained), FVCSR was correlated with FEV1SR, FEV1RSR and DL,COSR (0.75, 0.45 and 0.43, respectively). FEV1SR was correlated with FEV1RSR and DL,COSR (0.62 and 0.46, respectively) and DL,COSR was correlated with KCOSR (0.75; SR of KCO).
Multivariate Cox regression models were derived using age in deciles, smoking status, body mass index (BMI) and sex as predictors together with the grouping values for FEV1, FVC, FEV1R, DL,CO and KCO. The survival of the best group was used for comparing the hazard of death for all the other groups. The hazard of death for males was compared with that for females, and the hazard of death for the older age deciles was compared with that for the youngest decile for our patients (those aged <37.8 yrs). Cox regression models were also derived for the deciles for FVC·height−3, FEV1·height−3 and DL,CO·height−3, without the use of prediction equations. Table 3 shows the Chi-squared values for the models (larger values equate to a better fit) together with HR for male sex and for the worst grouping for the various prediction equations and height standardised indices.
The best lung function predictor of survival was DL,CO and the next best was FVC. Of complete sets of equations (spirometry and gas transfer), the Miller equations gave the best overall fit, as judged by the sum of Chi-squared values for the indices. For gas transfer on its own, Miller’s equations were the best fit and figure 1 shows the survival curves for each of the DL,COSR groups from Miller’s equations when including age, sex, smoking status and BMI in the Cox regression. For spirometry alone, there was less difference between the equations than that seen for gas transfer but the Miller and LMS equations were better overall than the others as judged by the sum of Chi-squared values for FVC and FEV1. The gas transfer results for Cotes and Roberts both had unusual HR for male sex, suggesting that there was some imbalance in the way the equations were accounting for sex differences. For FEV1·height−3, FVC·height−3 and DL,CO·height−3, the fit for each model was better than that for using any of the prediction equations but the HR for sex was different from that found when using the best prediction equations in the Cox model. The results for KCO, FEV1R, TLC and RV can all increase or decrease with disease states. HR < -3SR for FEV1R indicated survival advantage compared to those with the highest FEV1RSR values because in severe restrictive disease the FEV1R increases and these subjects have a high mortality. Analysis was, therefore, run with groups defined by the deviation of their absolute SR values from zero (equal hazard assumed for identical negative or positive deviation from predicted), but the predictive value of these models was worse. KCO, FEV1R, TLC and RV were not as powerful as predictors of mortality compared with DL,CO and FVC.

Survival curves for each of the standardised residuals of single-breath diffusing capacity of the lung for carbon monoxide (DL,COSR) groups from the Cox regression using, as survival predictors, the DL,COSR groups using the Miller equations, sex, age, body mass index deciles and smoking status.
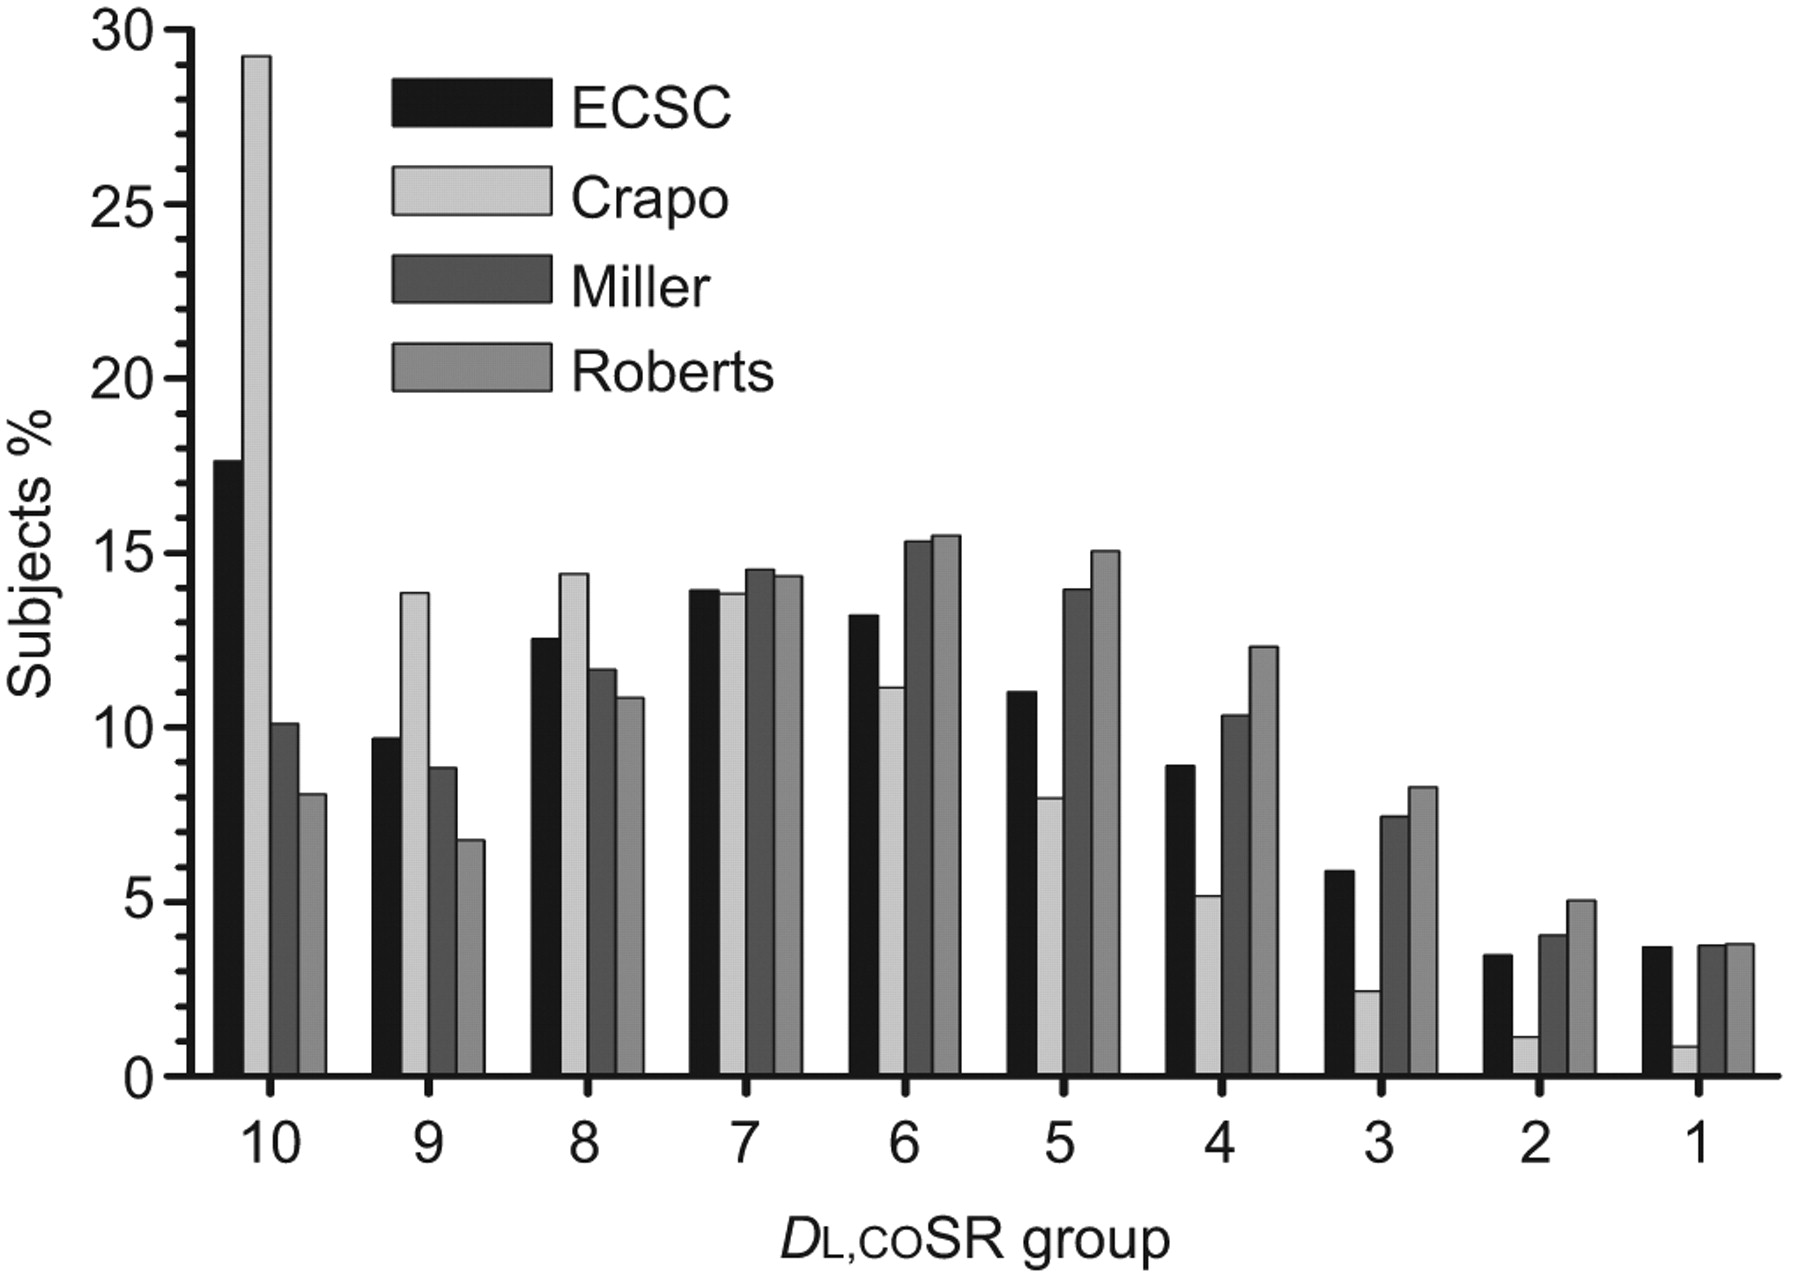
The way the equations spread the data was subtly different, as seen in figure 2, which shows how many subjects were in each of the 10 groups for each of the DL,CO equations. The Crapo equations, and to a lesser extent the ECSC equations, have very few subjects in the supra-normal range, whereas the other equations have a better spread. Figure 3 shows the same plot for FVC equations and here the reverse is true, with many subjects with the Crapo and ECSC equations being in the supra-normal categories. Figure 4 shows plots of DL,COSR values for the Miller equations versus DL,COSR for Roberts, Crapo, ECSC and Cotes. The Miller–Crapo plot has the best overlay of the sexes but the Crapo equations give more negative values versus Miller. For Cotes, Roberts and to a lesser extent ECSC, there was separation of the sexes, suggesting that the equations introduce some spurious sex effect as shown by the HR for sex in table 3. A plot of Miller DL,COSR against DL,CO·height−3 (not shown) gave a direct overlay of the sexes but with a broader spread than the Miller–Crapo plot.

Histograms of standardised residuals of single-breath diffusing capacity of the lung for carbon monoxide (DL,COSR), showing the spread of results for each of the prediction equations. Worst lung function groups (table 1) to the left (< -3.0) and best to the right (≥1.0). ECSC: European Community for Steel and Coal.

Histograms of standardised residuals of forced vital capacity (FVCSR), showing the spread of results for each of the prediction equations. Worst lung function groups (table 1) to the left (< -3.0) and best to the right (≥1.0). ECSC: European Community for Steel and Coal; LMS: Lambda-Mu-Sigma.

Plots of standardised residuals of single-breath diffusing capacity of the lung for carbon monoxide (DL,COSR) values from the Miller equations against those from a) Crapo, b) the European Community for Steel and Coal (ECSC), c) Roberts and d) Cotes. Regression lines for each sex are shown, with separation of the lines reflecting sex differences between the equations.
Multivariate predictions were undertaken including all the lung function indices available using the ECSC equations, which have a coherent set for all lung function indices, and when including indices standardised by the cube of height. The results of the best models are shown in table 4 with the HR for the worst two groups of each index included in the model. Age and DL,CO were the most important predictors, with FVC the next most important. Other indices could improve the Chi-squared result marginally but often without a meaningful or coherent increase in HR for the groupings of that index. Standardising by the cube of height reduced the HR for age, as some age effect is left within the index, but gave higher HR for the DL,CO groupings. HR values for sex were comparable but HR in both models for those with lowest FEV1 was protective, suggesting that, having taken FVC into account, those with lowest FEV1 (obstruction) had better survival than subjects with restriction.
DISCUSSION
We have shown that in a large UK patient dataset there are differences in the way various sets of prediction equations spread the results of the data and these differences impact on the ability to predict survival in these patients. This is the first time that the choice of lung function prediction equations has been referenced to survival and the technique indicates that predicting lung function from a large US dataset was best for our UK patients in this respect. Previous studies have explored comparisons of lung function reference equations, mainly for spirometry, using the distribution of percentage predicted (mean±sd) values [21] within a reference dataset and then exploring differences in classification, i.e. obstructive, restrictive, normal and mixed [22]. However, these studies were potentially affected by the fact that using percentage predicted retains an age, sex and height bias [23]; also, their end-points were relatively subjective. By linking choice of equation to survival, we used a better defined and clinically relevant end-point.
We have found that DL,CO was the best single predictor of survival in our patients and that FVC was next best, which confirms a previous study in a US population [24]. This probably reflects that DL,CO is a good overall descriptor of lung function, encapsulating both the size of the lungs and their gas exchange. RV, TLC, FEV1R and KCO were not such good predictors. These four lung function indices can be both abnormally high and abnormally low in different disease states and so their ability to predict survival may not be a linear function of their value. For FEV1, FVC and DL,CO, the index decreases as disease progresses and so it is reasonable that they would be able to predict survival. In mild and reversible airflow obstruction, FEV1 decreases but FVC is relatively preserved and in these cases mortality would not be so high. However, in severe airflow obstruction, FVC is decreased as well as FEV1 and so FVC will predict survival in more severe obstructive disease as well as in restrictive lung diseases.
The populations used to derive the equations we have tested had similarities, in that all were based on Caucasian populations, but there were some major differences. These differences included the equipment used to obtain the lung function measurements, periods of data collection (e.g. 1950s to 1990s), inclusion or exclusion of smoking history, altitude of the population, inclusion of patients with or without respiratory symptoms, age and height ranges, sex distribution and consideration of haemoglobin correction for gas transfer. Some of the equations we have tested [10, 19] were derived from population samples below the minimum of 150 subjects of each sex that has recently been suggested as necessary to obtain valid predictions [7], and this may account for the sex biases we have found. The US population giving the equations that best fit our lung function data was from Michigan and included some patients with mild respiratory symptoms. Michigan has a significant European immigrant population that includes ancestries from Germany, Ireland, the UK and France, which may contribute to Miller’s population seeming to be best for our UK patients.
We have shown in figure 4 and in the HR values for sex (table 3) that, for DL,CO, there were large sex differences introduced by some equations. This highlights how the choice of equation may suggest sex differences in disease prevalence that are in fact spurious. It is possible that there are true sex differences in the severity of certain lung conditions but our data have included the totality of lung diseases seen in a major centre and some subjects with normal results, so there is no expectation of sex differences in results across this broad population. It is agreed that SR are used to determine whether a subject’s result is deemed unusual when compared to that expected [4, 25], but the severity of any abnormality may be best judged by how far the result is from “the bottom line” [23]. Our analysis is the first to use DL,CO·height−3 and has shown that this makes it a better predictor of survival. This standardisation method has previously been shown to work for predicting survival from spirometry in the general population [20, 26], and the best spirometric equations for predicting survival in our patient data (LMS) also use a power relationship to height. Standardising DL,CO by the cube of height will take into account some size and sex differences but retains an age effect, as shown by reduction in the age-related hazard in table 4. The sex correction may not be perfect, as shown by HR for sex in table 3 for FVC·height−3 and FEV1·height−3 being different from the others, but for DL,CO·height−3 it appears reasonably representative.
A potential source of bias or influence in our approach relates to the 201 subjects whose survival data were not available. Their results were not skewed or different from the main group and so we think this would not bias our result. Our data do not have accurate diagnostic criteria to allow us to separate data into disease categories. Exact diagnosis would be of interest to see whether certain equations for the FEV1R are better than others in subjects with airflow obstruction. However, our results are not dependent on the specific diagnosis and the observed mortality was not skewed to a particular suggested diagnostic category, which means our findings may be more widely applicable. Some of our data may include a bias from including tests requested by specialist tertiary services, such as heart, lung or liver transplant, as well as some specialist neurophysiological and cancer services, but these subjects account for <10% of our referrals. Therefore, we believe our findings are pertinent and applicable to the usual mix of patients attending a major lung function laboratory. Most prediction equations do not confidently predict for subjects who are very elderly and 25% of our population were aged >70 yrs, where survival is expected to be less good. Future improvements in prediction equations for the very elderly may lead to different conclusions but we have tested in a manner consistent with how most laboratories use these equations.
Which equations are used in any given lung function laboratory has usually been decided by the director of the laboratory concerned. The ATS and ERS were careful not to mandate any particular set of equations [25]. Factors to consider in the choice include the demographics of the population, ethnicity, type of equipment used and the standards applied to the recording of the data. A perfect match for all these aspects is not usually possible. Thus, we have applied a different methodology for making the choice, based on the utility of the results obtained within the clinical population to which the equations are applied. This would seem to be a more valid approach and suggests that, where lung function tests are being undertaken, attempts should be made to obtain long-term follow-up including long-term survival so that this form of verification can be applied. Within the UK, this methodology could be widely applied, with anonymised lung function data accumulated from many sources into a national database to help improve the selection of lung function prediction equations.
We conclude that a novel approach using patient survival data can guide laboratories in the choice of best lung function prediction equations for their patients. Some equations seem to retain a sex bias, which may have an impact on the apparent prevalence of disease. We found that DL,CO was the best single predictor of survival in our patients, followed by FVC. The Miller equations, derived from a US population [17], were best for DL,CO, and the Miller and new LMS equations [11, 12] were equivalently good for spirometry in our patients.
Acknowledgments
We thank all the staff in the lung function laboratory at the University Hospital Birmingham NHS Trust (Birmingham, UK) for their dedication to obtaining the best results possible for our patients.
Footnotes
Statement of Interest
None declared.
- Received June 20, 2011.
- Accepted September 2, 2011.
- ©ERS 2012
REFERENCES


