Article Text

Abstract
Background The usual analysis of forced oscillometry measures respiratory resistance (Rrs) and reactance (Xrs) averaged over several tidal breaths (whole-breath analysis). Recent within-breath analyses have separated Rrs and Xrs into their mean inspiratory and mean expiratory components (inspiratory–expiratory breath analysis) but these have not been used to compare patients with asthma and those with chronic obstructive pulmonary disease (COPD). Large inspiratory–expiratory variations in Xrs at 5 Hz (ΔX5) in an individual have been used as a surrogate marker of expiratory flow limitation.
Methods Whole-breath and inspiratory–expiratory impulse oscillometry was assessed in 34 patients with asthma (49±3 years; 15 male, forced expiratory volume in 1 s (FEV1) 69±4% predicted), 48 patients with COPD (64±2 years; 32 male, FEV1 59±3% predicted) and 18 normal subjects (37±2 years; 8 male).
Results Whole-breath analysis failed to discriminate between patients with asthma and patients with COPD either for all patients or for patients with FEV1 <60% predicted. Inspiratory–expiratory analysis in patients with FEV1 <60% predicted showed that in the COPD group mean expiratory X5 (−0.44±0.04 kPa/l/s) was greater than inspiratory X5 (−0.23±0.02 kPa/l/s, p<0.001) whereas patients with asthma did not show such changes (−0.36±0.07 kPa/l/s vs −0.26±0.03 kPa/l/s, p=0.23). Even though ΔX5 was larger in patients with COPD (0.21±0.03 kPa/l/s) than in patients with asthma (0.10±0.07 kPa/l/s), this was not significant (p=0.15).
Conclusions Whole-breath impulse oscillation system analysis failed to discriminate between patients with asthma and those with COPD. Inspiratory–expiratory X5 analysis differentiated patients with asthma from those with COPD presumably reflecting enhanced dynamic airway narrowing on expiration in COPD. Further studies are needed to confirm these differences and investigate their cause.
- Asthma mechanisms
- COPD mechanisms
- equipment evaluations
- expiratory forced oscillometry
- inspiratory forced oscillometry
- lung physiology
- reactance
- respiratory measurement
- resistance
Statistics from Altmetric.com
- Asthma mechanisms
- COPD mechanisms
- equipment evaluations
- expiratory forced oscillometry
- inspiratory forced oscillometry
- lung physiology
- reactance
- respiratory measurement
- resistance
Introduction
Standard assessment of obstructive lung disease uses the forced expiratory volume exhaled in 1 s (FEV1) and the FEV1/forced vital capacity (FVC) ratio; these measurements assess severity of airflow obstruction, but not the underlying pathophysiology, which may vary between asthma and chronic obstructive pulmonary disease (COPD).
Airflow resistance during tidal breathing provides a more physiological assessment of airflow obstruction. The first non-invasive method to do this, using the body plethysmograph, was introduced >50 years ago1 but required expensive and cumbersome equipment, limiting its practical use. A more user- and subject-friendly method, analysing the pressure/flow response to small forced oscillations imposed during tidal breathing, has been progressively developed for clinical use over the years.2 The instantaneous pressure/flow response to the imposed oscillations is analysed to obtain the impedance of the respiratory system to breathing (Zrs); the in-phase part of this signal measures airflow resistance (Rrs). Further developments of this forced oscillation technique (FOT) have allowed Rrs to be measured over a wide range of frequencies.
An additional pressure/flow response to imposed oscillations, respiratory reactance (Xrs), has received less attention; possibly because, unlike airflow resistance, there are no alternative methods with which Xrs can be compared and its physiological significance has been uncertain. In recent years, however, interest in the interpretation of Xrs in obstructive disease has increased.3–8 Of particular clinical interest is the comparison of inspiratory and expiratory Xrs, measured at a frequency of 5 Hz,3 as a surrogate marker of expiratory flow limitation (EFL) during tidal breathing. With these developments FOT now provides several potential insights into the underlying pathophysiology of different obstructive diseases.
In this study we used the impulse oscillation system (IOS) to examine whether oscillometric indices differ between patients with asthma and patients with COPD. In both diseases a wide range of severity of airflow obstruction, as assessed by spirometry, was studied.
Methods
Patients
Thirty-four patients with asthma (15 male, age 49±3 years, FEV1 69±4% predicted) were enrolled, in whom the diagnosis of asthma was established according to American Thoracic Society (ATS) criteria.9 All were treated with β2 agonists, and 24 with β2 agonists and inhaled corticosteroids (table 1).
Patient characteristics
We enrolled forty-eight patients with COPD (32 male, age 64±2 years, FEV1 59±3% predicted) who met ATS criteria for the diagnosis of COPD10 (FEV1 <80% predicted, FEV1/FVC ratio <70% predictded and total lung capacity (TLC) >80% predicted). Patients were staged following Global Initiative for Obstructive Lung Disease (GOLD) criteria (6, stage 1, 30 stage 2, 8 stage 3, and 4 stage 4 COPD). Twenty-seven were ex-smokers and 21 current smokers with ≥20 pack-year smoking history. None had a past medical history of allergic disease or reversibility of airflow obstruction >15% or >200 ml after 400 μg of salbutamol via a metered dose inhaler. The patients were clinically stable, and their spirometric values were close to their best previous values.
Eighteen normal subjects (8 male, age 37±2 years, FEV1 97±3% predicted) were recruited from hospital staff. All were never-smokers, with no history of upper respiratory tract infection for at least 4 weeks. This study has ethics approval.
Forced oscillation technique
Procedure
A Jaeger IOS (Jaeger, Wurzburg, Germany) was used as reported previously.8 The pneumotachometer was calibrated daily using a 3 litre syringe, and pressure calibration was checked weekly with a reference resistance (0.2 kPa/l/s). To minimise tongue malposition, we used a ‘free-flow’ mouthpiece that stabilises tongue position, with a built-in tongue depressor to minimise oral resistance. The subjects firmly supported their cheeks while sitting with the neck in a comfortable neutral posture. Subjects wore a noseclip, and tightly sealed their lips around the mouthpiece to avoid air leaks. Pressure pulses are applied to the airway five times per second during 60 s of tidal breathing. Mean Rrs and Xrs were calculated between 5 and 35 Hz. Reported results are averages of 3–4 technically acceptable periods of 40–60 s of tidal breathing.
Data analysis
Primary data (pressure, volume and flow) were replayed using IOS software (version 4.67). Artefacts such as coughing and swallowing were excluded by limiting analysis to periods free of spikes in magnitudes of R5 and X5 as previously reported.3 Airflow leaks were excluded by high-gain display of volume in time, analysing only tidal breaths free of impulse transients. After this editing we tabulated mean whole-breath values of resistance and reactance at 5 Hz (R5, X5), resistance at 15 Hz (R15), resonant frequency (Fres) and low-frequency reactance area (AX, integrated Xrs from 5 Hz to Fres) averaged over 3–4 satisfactory tests. To avoid confusion in the description of Xrs becoming more negative, we describe the magnitude of Xrs. When low-frequency Xrs becomes more negative, its magnitude increases. In the inspiratory–expiratory breath analysis of the same edited data, we report average values of inspiratory and expiratory R5 and X5 as provided separately by IOS software. Finally, we calculated differences in each individual between inspiratory and expiratory R5 and X5 to obtain ΔR5 and ΔX5.
Lung function tests
All patients underwent spirometry, using a Jaeger Master Lab Compact Transfer (Erich Jaeger, Market Harborough, UK). The predicted values of spirometry were calculated in accordance with the European guidelines.11
Statistics
Comparisons between groups were made by two-way analysis of variance (ANOVA), and the Student t test was used for comparisons between two groups. The Wilcoxon matched pairs test was used to analyse inspiratory–expiratory R5 and X5 changes (ΔR5, ΔX5). All normally distributed data were expressed as the mean±SEM and CIs of differences. Significance was defined as a p value of <0.05. Correlation coefficients between R5 and X5 and FEV1 were calculated using linear regression analysis. Because this is an exploratory investigation and the first to compare inspiratory–expiratory FOT analysis in patients with asthma and with COPD the study was powered based on a previous publication12 which used whole-breath analysis comparisons in the same group of patients.
Results
Whole-breath analysis
All patients
Resistance (R5, R15)
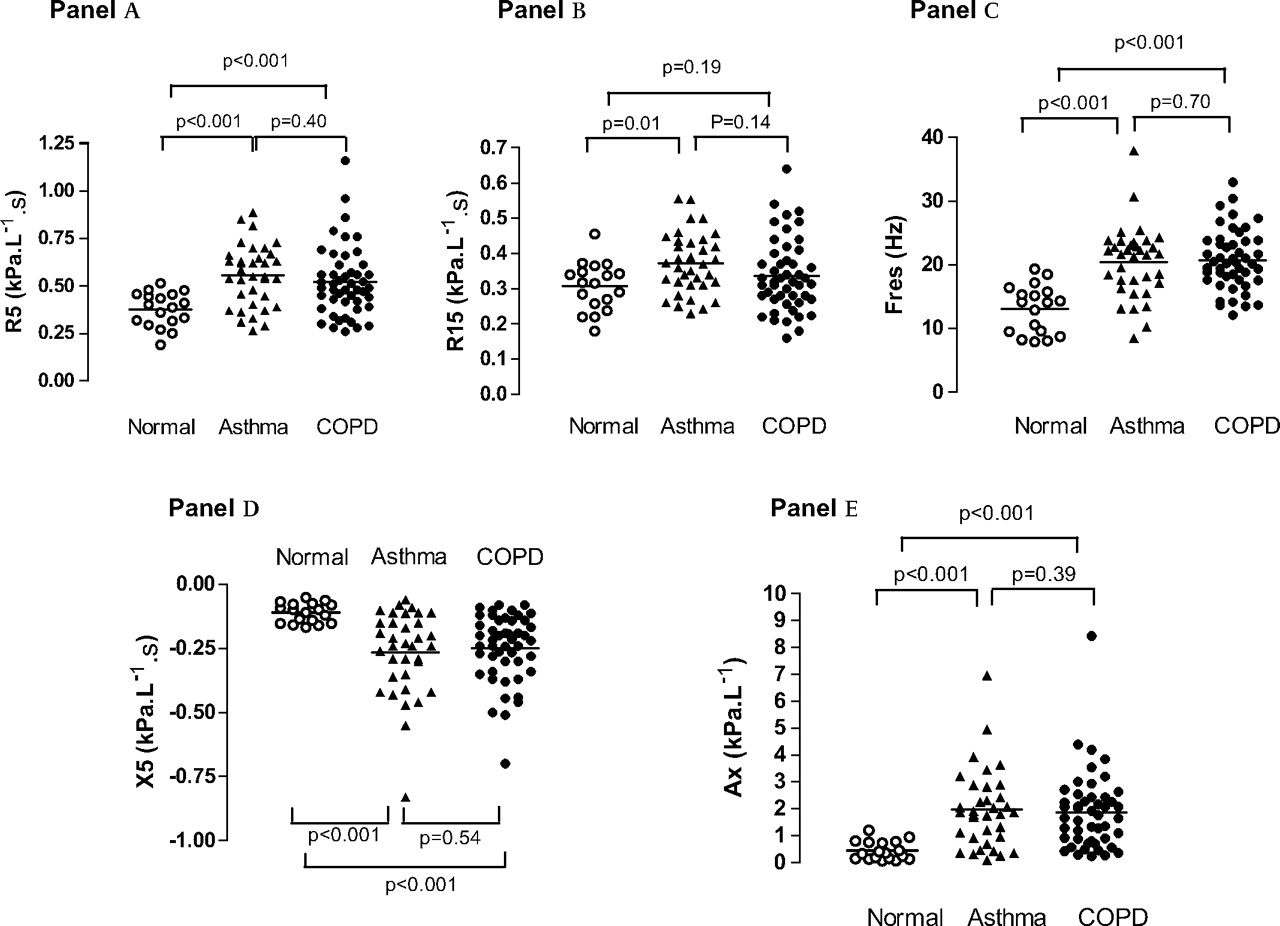
R5 was similarly elevated in patients with asthma (0.55±0.03 kPa/l/s) and COPD (0.52±0.03 kPa/l/s, p=0.40) (figure 1A); in both patient groups mean R5 was significantly higher than in normal subjects (0.38±0.02 kPa/l/s, p<0.001).

Comparison of whole-breath resistance at 5 Hz (R5) (A), R15 (B), resonant frequency (Fres) (C), reactance at 5 Hz (X5) (D) and reactance area (Ax) (E) in patients with asthma (filled triangles), patients with chronic obstructive pulmonary disease (COPD) (filled circles) and in normal subjects (open circles). The values are expressed as a mean of the total (inspiratory+expiratory) values.
R15 was not significantly different in patients with asthma (0.37± 0.02 kPa/l/s) or COPD (0.34±0.01 kPa/l/s, p = 0.14, figure 1B). Patients with asthma had significantly higher R15 than normal subjects (0.31±0.02 kPa/l/s, p=0.01).
R5 was significantly correlated with FEV1 in COPD (r=−0.47, p<0.05) but not in patients with asthma (r=−0.3, p>0.05) (data not shown).
Reactance (X5, Fres, AX)
Fres was similarly elevated in patients with asthma (20.34±0.97 Hz) and COPD (20.72±0.68 Hz) (p=0.7) compared with normal subjects (13.08±0.89 Hz, p<0.001, figure 1C).
X5 was more negative (greater magnitude) in patients with asthma and those with COPD (−0.26±0.03 and −0.25±0.02 kPa/l/s, respectively, p=0.54) than in normal subjects (−0.11±0.01 kPa/l/s, p<0.001, figure 1D). X5 was significantly correlated with FEV1 (not shown) in both COPD (r=0.58, p<0.05) and asthma (r=0.45, p<0.05).
AX was elevated in patients with asthma and those with COPD (1.92±0.25 and 1.88±0.21 kPa/l, p=0.39, respectively) compared with normal subjects (0.44±0.08 kPa/l, p<0.001, figure 1E).
Patients with FEV1 <60% predicted
Both patients with asthma and those with COPD with higher values of R5, R15, Fres, X5 and AX had more abnormal spirometry; however, none of these differences was statistically significant (all p values >0.05), and again whole-breath analysis did not discriminate between patients with asthma and patients with COPD (table 2).
Whole-breath, inspiratory and expiratory results
Inspiratory–expiratory breath analysis
Normal subjects
There were only minimal changes in R5 and X5 between inspiration and expiration, with correspondingly small values of ΔR5 (inspiratory R5–expiratory R5) and ΔX5 (inspiratory X5–expiratory X5) in individuals (table 2).
Patients with FEV1 >60% predicted
Patients with asthma and patients with COPD showed significantly greater R5, X5, ΔR5 and ΔX5 than normal subjects (all p values <0.01), with no statistically significant differences between asthma and COPD (all p values >0.05) (table 2).
Patients with FEV1 <60% predicted
X5
In patients with asthma, group mean inspiratory X5 (−0.26±0.03 kPa/l/s) was not significantly different from mean expiratory X5 (−0.36±0.07 kPa/l/s, p=0.23) (figure 2A, table 2). However, in patients with COPD, inspiratory mean X5 magnitude (−0.23±0.02 kPa/l/s) (table 2) was significantly less than mean expiratory X5 (−0.44±0.04 kPa/l/s, p<0.001) (figure 2B).

Inspiratory and expiratory reactance at 5 Hz (X5) (A and B) and resistance at 5 Hz (R5) (D and E) in patients with asthma and patients with chronic obstructive pulmonary disease (COPD) with severe airflow obstruction (forced expiratory volume in 1 s (FEV1) <60% of the predicted value). C and F show ∆X5 and ∆R5 (inspiratory–expiratory values) in each individual. Open symbols, ∆R5 for subjects with ∆X5 >0.25 kPa/l/s; filled symbols, ∆R5 for subjects with ∆X5 <0.25 kPa/l/s. Subjects with high ∆X5 do not consistently have particularly large negative values of ∆R5.
ΔX5
ΔX5 was larger in patients with COPD (0.21±0.03 kPa/l/s) than in patients with asthma (0.10±0.07 kPa/l/s), but this was not statistically significant (p=0.15) (table 2). Eight patients with COPD and two patients with asthma had an X5 >0.25 kPa/l/s (figure 2C).
R5
In the patients with asthma, mean inspiratory R5 was 0.54±0.03 kPa/l/s, and mean expiratory R5 was 0.59±0.04 kPa/l/s, p=0.02 (table 2, figure 2D). In patients with COPD there was a more substantial inspiratory–expiratory difference: inspiratory R5 0.54±0.04 kPa/l/s, expiratory R5 0.63±0.04 kPa/l/s, respectively, p<0.001 (table 2, figure 2E).
ΔR5
ΔR5 was similar in patients with COPD (−0.09±0.02 kPa/l/s) and in those with asthma (−0.05±0.02 kPa/l/s, p=0.52) (table 2). Importantly, patients with large ΔX5 changes (>0.25 kPa/l/s, open symbols) did not show correspondingly large negative values of ΔR5 (figure 2F).
Discussion
In the present study conventional whole-breath oscillometry failed to distinguish between patients with asthma and those with COPD. However, inspiratory–expiratory analysis revealed differences in the scale of respiratory variation in reactance between patients with asthma and patients with COPD with FEV1 <60% predicted value.
The measurement of whole-breath impedance showed that, as expected, Rrs and Xrs were significantly elevated in both patients with asthma and patients with COPD, but did not distinguish between the two diseases not even when patients with more severely affected lung function were compared. In keeping with our results, Van Noord et al found, in a large and detailed study of FOT in 1991, that any separation between asthma and COPD based on analysis of whole-breath impedance was ‘weak and not useful for diagnostic purposes’.12 These authors also found that FOT parameters were only weakly correlated with FEV1.
Since this classic study a major development has been the separate inspiratory and expiratory analysis of Rrs and Xrs. The present study was an initial exploration of inspiratory–expiratory differences in resistance and reactance in patients with asthma compared with patients with COPD. We observed greater expiratory X5 magnitudes relative to inspiratory X5 in patients with COPD but not in patients with asthma with the same degree of severe spirometric obstruction. This may be an expression of increased expiratory narrowing of airways in patients with COPD. Further studies are needed to confirm these differences, investigate their cause and establish the usefulness of FOT in monitoring lung disease.
Respiratory phase differences in X5 may be used to identify EFL,3–6 which can be defined as absence of increased expiratory airflow despite an increase in driving pressure. EFL may be present in some patients with COPD during tidal breathing at rest. Dellaca et al3–6 showed that in subjects with COPD, large values of ΔX5 indicated EFL, proven by oesophageal manometry, with high sensitivity and specificity and established threshold values for its detection. Hence, some of the large values of ΔX5 we observed in patients with COPD and, less frequently, in patients with asthma may be due to EFL. However, our results were obtained with IOS while Dellaca’ group used different methods; therefore, the threshold value identified by Dellaca may not be applicable to our patients with COPD (or asthma) and would have to be established for IOS by further studies.
In contrast to ΔX5, respiratory Rrs variations have not been associated with EFL in patients with COPD.3–6 In the present study only reactance allowed differentiation between patients with COPD and those with asthma. This is consistent with pioneering studies by Clement et al13 showing that reactance better identifies patients with different degrees of COPD severity, whereas resistance may be less sensitive. That reactance may be a more sensitive marker of COPD mechanics during exacerbations than R5 has also been recently shown by Johnson et al14 who showed a larger change of inspiratory reactance compared with inspiratory resistance during COPD exacerbations, confirming their previous findings that reactance provides a better estimate of transpulmonary resistance than Rrs8 in severely obstructed patients.
Most inspiratory–expiratory FOT studies in patients with COPD have utilised sinusoidal pressure forcing; however, an early investigation used pseudorandom noise,15 and more recently Kubota et al have used IOS16 and found similar results to those in the present study.
Compared with static dimensions at a given lung volume, transmural pressures of intrathoracic airways will be larger during tidal inspiration and will tend to distend the airways, whereas during tidal expiration transmural pressures will be smaller and tend to narrow these airways. When airway resistance is low, the gradient of intra-airway pressure between the mouth and alveoli is small and this dynamic effect is small, and the inspiratory–expiratory difference in resistance is also small, as shown in the normal subjects in the present study. When airway resistance is increased, the inspiratory–expiratory differences in transmural pressures at isovolume are increased and dynamic effects are more obvious, and this is reflected in the trend for expiratory R5 to be greater than inspiratory R5 in both asthma and COPD in the present study. This trend does not depend on the presence of EFL, but would be expected to be amplified if EFL during tidal breathing was present. In fact, as suggested by the small increase in total (whole-breath) R5 in the patients with FEV1 <60% predicted compared with patients with FEV1 >60% predicted, inspiratory–expiratory differences in R5 were only slightly greater in the patients with lower FEV1. This may reflect a progressive underestimation of R5 as obstruction worsens. Comparisons of R5 with other methods of measuring resistance have shown a trend for R5 to underestimate true resistance in the most obstructed patients.8 14 17
In conclusion, despite similar whole-breath average R5 and X5 in asthma and COPD, the magnitude of inspiratory–expiratory reactance differences was greater in patients with COPD. This may result from enhanced dynamic airway narrowing in COPD. Further studies are needed to confirm these differences and investigate their cause.
References
Footnotes
Funding Supported by the National Heart and Lung Institute, London UK.
Competing interests None.
Ethics approval This study was conducted with the approval of the Royal Brompton Hospital Ethics Committee.
Provenance and peer review Not commissioned; externally peer reviewed.