Article Text

Abstract
Background Obstructive sleep apnoea (OSA) is a common disease that leads to daytime sleepiness and cognitive impairment. Attempts to investigate changes in brain morphology that may underlie these impairments have led to conflicting conclusions. This study was undertaken to aim to resolve this confusion, and determine whether OSA is associated with changes in brain morphology in a large group of patients with OSA, using improved voxel-based morphometry analysis, an automated unbiased method of detecting local changes in brain structure.
Methods 60 patients with OSA (mean apnoea hypopnoea index 55 (95% CI 48 to 62) events/h, 3 women) and 60 non-apnoeic controls (mean apnoea hypopnoea index 4 (95% CI 3 to 5) events/h, 5 women) were studied. Subjects were imaged using T1-weighted 3-D structural MRI (69 subjects at 1.5 T, 51 subjects at 3 T). Differences in grey matter were investigated in the two groups, controlling for age, sex, site and intracranial volume. Dedicated cerebellar analysis was performed on a subset of 108 scans using a spatially unbiased infratentorial template.
Results Patients with OSA had a reduction in grey matter volume in the right middle temporal gyrus compared with non-apnoeic controls (p<0.05, corrected for topological false discovery rate across the entire brain). A reduction in grey matter was also seen within the cerebellum, maximal in the left lobe VIIIb close to XI, extending across the midline into the right lobe.
Conclusion These data show that OSA is associated with focal loss of grey matter that could contribute to cognitive decline. Specifically, lesions in the cerebellum may result in both motor dysfunction and working memory deficits, with downstream negative consequences on tasks such as driving.
- Sleep
- obstructive sleep apnoea
- MRI
- voxel based morphometry
- cortical grey matter
- imaging/CT MRI etc
- respiratory measurement
- sleep apnoea
Statistics from Altmetric.com
- Sleep
- obstructive sleep apnoea
- MRI
- voxel based morphometry
- cortical grey matter
- imaging/CT MRI etc
- respiratory measurement
- sleep apnoea
Introduction
Obstructive sleep apnoea (OSA) is a common disorder that causes intermittent hypoxia and frequent arousals from sleep, leading to extreme daytime sleepiness and increased cardiovascular risk.1 2 There is also a well-recognised link between OSA and cognitive impairment.3–5 Specific impairments include reductions in working memory, phonological fluency, cognitive flexibility and planning; these can reduce efficiency at work, the ability to learn new tasks and remember instructions,6 and may underlie the increased road traffic accidents found in this population.7 Despite this link between OSA and cognitive impairment, little is known about neural deficits that may underlie these sequelae. Changes in neural activation associated with cognitive impairment8–13 and autonomic dysfunction14 have been recorded using functional MRI (fMRI) in patients with OSA; it is possible these functional changes are due to structural deficits.
Severe hypoxia and anoxia results in diffuse neurodegeneration15 whereas exposure to intermittent hypoxia has been shown to produce cellular damage within the CA1 region of the hippocampus and adjacent cortex in rats.16 In patients with OSA, several studies have used voxel-based morphometry (VBM) techniques to analyse structural magnetic resonance (MR) brain scans for changes in brain morphology.17–20 VBM enables voxel-wise comparisons of grey matter volume between two groups across the whole brain.21 Detection of a reduction in grey matter reflects neural damage or hypotrophy and is observed in a number of brain diseases, as well as normal ageing towards the latter part of life.22
Diffuse changes in grey matter concentration across the entire brain have been found in patients with OSA using VBM techniques, including the frontal, parietal and temporal cortices, anterior cingulate, hippocampus and cerebellum17 and bilateral prefrontal cortex, inferior parietal gyrus, right temporal and occipital cortices, right thalamus, some of the basal ganglia, right hippocampus and parahippocampal gyrus and cerebellum (right cerebellar hemisphere and vermis).20 However, these studies used a relatively low threshold for statistical significance (p<0.001) uncorrected for multiple comparisons,17 or contained relatively few patients (n=16+20). A smaller focal loss of grey matter within the left hippocampus was found in a very small group of patients with OSA (n=7) using a level of significance selected on the basis of an a priori hypothesis.18 In contrast, a more stringent analysis (p<0.05, corrected for multiple comparisons using false discovery rate, FDR) showed no significant reductions in grey matter.19 All these studies had relatively small sample sizes (between 7 and 27 patients), they used different statistical thresholds and covariants, and some included patients with known comorbidities which might affect brain structure. This has resulted in confusion within the field. The present study aimed to determine whether OSA is associated with a focal loss of grey matter by studying a relatively large group of patients with OSA (n=60) compared with a group of controls (n=60) of similar age and gender using standardised improved methods of VBM analysis. Analyses of 60 of the 120 scans presented in this paper have been published elsewhere, although the analysis technique used has since been improved.18 19
Methods
Subjects
Patients were recruited from sleep clinics in Melbourne, Australia (Department of Respiratory and Sleep Medicine, Austin Health) and London, UK (Royal Brompton and Charing Cross Hospitals). Patients with an apnoea/hypoponea index (AHI) >30 events/h were invited to participate in the study. The Melbourne patients also had to have at least 15% of total sleep time spent at oxygen saturation (Sao2) <90%. Exclusion criteria were a clinical diagnosis or history of respiratory disease, cerebrovascular or ischaemic heart disease, diabetes mellitus, central nervous system disorders (neurodegenerative diseases, epilepsy, head injury, psychosis, hypothyroidism, current depression), alcohol or illicit drug abuse, or current intake of psychoactive medications. Healthy controls were recruited by newspaper advertisement and through our database of healthy volunteers. In addition to the exclusion criteria above, the controls were also excluded from participation if they had a history of habitual snoring or any other sleep complaint. All control subjects were screened with polysomnography and questionnaire to exclude OSA.
Apnoeas were defined as >80% drop in airflow for ≥10 s in the London dataset and a complete cessation of airflow for ≥10 s in the Melbourne data set. Hypopnoeas were defined as >50% reduction in airflow from baseline with a >4% dip in saturation, or an arousal from sleep in the London dataset, and >50% decrease in airflow without a requirement for associated oxygen desaturation or arousal, plus those with a lesser airflow reduction in association with oxygen desaturation of >3% or an arousal in the Melbourne dataset. Control subjects had an AHI <5 events/h when airflow was measured by thermistor, or <15 events/h when airflow was measured by nasal cannula.23 24 The study was approved by the research and ethics committees in both institutions and all subjects gave informed written consent.
MRI protocol
Twenty-six patients with OSA and 25 healthy controls were studied in Melbourne, Australia. T1-weighted MR images were acquired using a 3.0 T scanner (General Electrics Horizon LX, Milwaukee, WI, USA). A fast spoilt, gradient-recalled echo at steady state sequence (time to repeat (TR) 13.8 ms, time to echo (TE) 2.7 ms, time to inversion (TI) 500 ms, in-plane resolution 0.49×0.49 mm) with contiguous coronal slices of 2 mm thickness was used. Thirty-four patients with OSA and 35 healthy controls were studied in London, UK. T1-weighted MR images were acquired using a 1.5 T scanner (Magnetom Vision, Siemens Healthcare, Camberley, Surrey, UK) and a 3D MP-RAGE sequence (TI 300 ms, TE 4 ms, in-plane resolution 1.0×1.0 mm) with contiguous 2 mm coronal slices.
Voxel-based morphometry
VBM is an objective whole brain approach that enables comparisons of regional volumetric differences between groups.21 Briefly, VBM involves the segmentation of anatomical T1-weighted MR scans into grey matter, white matter and cerebrospinal fluid. The grey matter segments are then spatially normalised into standard stereotactic space using non-linear regression to align homologous regions across subjects. The resulting grey matter images are spatially smoothed to account for any remaining variation in gyral anatomy between individuals and to reduce spatial noise. Statistical analysis using the general linear model is performed to localise group differences using dedicated brain image analysis software (SPM; http://www.fil.ion.ucl.ac.uk/spm). The ‘optimised VBM’ process used by previous publications in this field17–19 has now been improved by procedures within the current SPM software (SPM8) which provides higher quality spatial normalisation and segmentation; indeed, these steps are now combined (see below). In addition, SPM8 allows control of the FDR (a method used for controlling the false positive rate when performing multiple tests) of topological features (ie, clusters of voxels) which is more appropriate than controlling the FDR of individual voxels25 as was used in previous studies.19 The analysis output is produced in the form of a statistical parametric map (SPM) displaying voxels in which grey matter volume is significantly different from that which occurs in a control group.
In the present study the segmentation and normalisation steps were combined within a unified probabilistic framework provided in SPM8.26 In separate analyses the modulated grey matter segments were smoothed using either 8 or 12 mm Gaussian full-width-half-maximum smoothing kernels and saved at a voxel size of 2×2×2 mm. The total intracranial volume was then calculated as the sum of the grey matter, white matter and cerebrospinal fluid segments over the whole brain.
Spatially unbiased infratentorial template (SUIT) analysis
There are intrinsic difficulties in the analysis of MR images of the cerebellum.27 In particular for VBM, standard spatial normalisation templates are optimised for the cortex and not for the cerebellum. These shortcomings in the standard template result in suboptimal grey matter segmentation of cerebellar tissues and potential inclusion of non-cerebellar tissue within the region of interest,27 factors that reduce accuracy and sensitivity. Furthermore, signal dropout can be relatively high in the cerebellum due to local field inhomogeneities. To address these issues we performed an additional analysis of the cerebellum using spatial segmentation and normalisation with a dedicated cerebellar template (spatially unbiased infratentorial template, SUIT 2.2).27 This template, based on the average anatomy of 20 healthy individuals, preserves the anatomical detail of the cerebellum better than the Montreal Neurological Institute whole brain template. The SUIT approach has been shown to increase the sensitivity of functional imaging studies which require accurate cerebellar normalisation by about 15%.27
In brief, the MR image was masked using the cerebellum template before normalisation such that no supratentorial grey matter can bias the results. The subsequent normalisation and segmentation process used this cropped image and a classification map to create a non-linear deformation map matched to the SUIT template using the cosine-basis function approach.28 Finally, the images were resliced into the new atlas space and smoothed with 8 mm and 12 mm kernels.
Statistical analysis
Subject characteristics including age, body mass index (BMI) and sleep-disordered breathing parameters were tested using independent sample t tests to compare the patients with OSA and healthy controls.
Normalised (non-linearly registered) GM images were compared using a factorial design with site (London and Melbourne) and diagnosis (OSA patients and healthy controls) as factors. Age, sex and intracranial volume were included as covariates. By modelling the data in this way we were able to investigate the differences in grey matter volume between patients with OSA and healthy controls after adjusting for intersite differences in the imaging equipment and acquisition parameters.
Statistical parametric maps were first thresholded at p<0.001 uncorrected for multiple comparisons and then inferences about regionally specific grey matter volume differences were made using a significance threshold level of p<0.05 corrected for topological FDR across the whole brain.25 For the cerebellar analysis conducted as a post hoc comparison, the statistical threshold was set using a more stringent correction for multiple comparisons (p<0.05 family wise error (FWE)) across the cerebellum. These thresholds were chosen as the standard minimum acceptable to exclude excessive false positives.29 To assess the spatial homogeneity of the sensitivity to detect an effect, a sensitivity map was constructed that indicated the minimum change in grey matter volume required for each voxel to reach significance at p<0.001 uncorrected, following a variation of the method described in the appendix of the paper by Abbott et al.30 Specifically, rather than expressing sensitivity of each voxel as a percentage change in volume, we expressed sensitivity as an absolute change in volume in the same units as the contrast images (ie, we did not multiply by 100/local mean of the voxel).
The cerebellar SUIT analysis was conducted using a similar statistical model to that for the whole brain. Differences in overall cerebellar/brainstem volume were accounted for by including the combined grey and white matter volume of the segmented region as a covariate. One hundred and eight MR brain scans (52 patients with OSA, 56 healthy controls) were included in the SUIT analysis. Twelve scans (8 patients with OSA, 4 healthy controls) were excluded owing to poor cerebellar image quality or problems with segmentation in the cerebellum.
Results
One hundred and twenty MR brain scans were analysed. Subject characteristics are given in table 1. Sixty patients with severe OSA (26 recruited in Melbourne and 34 in London) and 60 healthy controls (25 in Melbourne and 35 in London) were studied. Overall, patients with OSA patients had a higher AHI, oxygen desaturation index, BMI and subjective sleepiness score (Epworth Sleepiness Scale, ESS) than healthy controls (all p<0.001). There was no significant difference in the age between the two groups (p=0.68).
Characteristics of study subjects
Patients with OSA had a significant reduction in grey matter volume in the right middle temporal gyrus, extending along the occipito-temporal sulcus inferiorly (p<0.05 corrected for topological FDR across the entire brain) compared with healthy controls (figure 1A). The outcome of the statistical analysis was similar for both the 8 mm and 12 mm smoothing kernels applied in preprocessing. The whole brain analysis also showed a significant reduction in cerebellar grey matter volume in a single bilateral region, with greatest extent and the voxel-wise statistical maximum within the left lobe (figure 1B). This finding was confirmed using the SUIT analysis, the location of the grey matter loss being within the left cerebellum lobe VIIIb but close to IX (p<0.05 corrected for FWE across the cerebellum; figure 2).

Images showing reductions in grey matter in patients with obstructive sleep apnoea (OSA) compared with controls. The left panel shows the ‘glass brain’ view and the right panel shows grey matter loss superimposed on an MR template. Views in neurological orientation (left is left) from top left clockwise are sagittal, coronal and transverse. (A) Reductions in grey matter in right middle temporal gyrus of patients with OSA compared with controls. The voxel of maximum significance is marked with an arrowhead in the left panel. In the right panel the cross hairs (t=4.05, indicated by a coloured bar) are located on the right at x=52, y=4, z=−22 mm (Montreal Neurological Institute (MNI) coordinates relative to the anterior commissure). The images are thresholded to include clusters that survived the topological false detection rate threshold of p<0.05. (B) Reductions in grey matter in left cerebellum lobe VIIIb but close to IX in patients with OSA compared with controls. In the right panel the voxel of maximum significance (t=5.95) is located on the left at x=−12, y=−62, z=−56 mm (MNI). Note: the location of the cerebellum and the associated grey matter reduction extends below the standard glass brain reference grid.

Images showing statistically significant reductions in cerebellar grey matter in a subset of patients with obstructive sleep apnoea (OSA) compared with controls using a spatially unbiased infratentorial template (SUIT): (A) ‘glass brain’ view; (B) superimposed on SUIT template. The image is displayed with a threshold of p<0.001 uncorrected. The voxel of maximum significance survives correction at p<0.05 family wise error (few) corrected (t=4.62, indicated by coloured bar) and is located on the left at x=−14, y=−51, z=−48 mm (Montreal Neurological Institute (MNI) coordinates relative to the anterior commissure). Two further maxima were located on the inferior edge of the cerebellum (t=4.18: MNI: −50, −58, −55; t = 3.99: MNI: −35, −53, −62). Note: the location of the cerebellum and the associated grey matter reduction extends below the standard glass brain reference grid.
The sensitivity analysis showed homogeneity in the ability to detect change throughout the brain, except for the brainstem and adjacent to the interhemispheric fissure (figure 3). The mean (SD) sensitivity within the regions of significant volume loss was 0.054 (0.007). To assess where in the brain the sensitivity was approximately as good or better than the regions in which there was a significant finding, we displayed the sensitivity map in pseudocolour such that cool colours (blue and green) indicate sensitivity as good or better than two standard deviations above the mean sensitivity of the regions of significant volume loss (ie, 0.067). Warm colours in the figure indicate areas where a larger volume change would be required before we could detect it in our study. This is about twice the sensitivity of our previous study.19 Maps showing the effect size associated with the change in grey matter are shown in figure 4. They indicate larger changes in the right temporal cortex and in the left cerebellum, changes that are consistent with the patterns of statistical significance.

Sensitivity map of orthogonal planes passing through the anterior commissure (Montreal Neurological Institute 0, 0, 0). The map indicates the minimum change in grey matter volume required for each voxel to reach significance at p<0.001 uncorrected (smaller is better). The mid point of the colour scale (0.067) is two standard deviations above the mean sensitivity of the voxels which were found to exhibit a significant difference between the groups (as illustrated in figure 1A,B). Cool colours (green and blue) indicate brain regions in which it would be expected that changes of approximately a similar magnitude could be detected, whereas warm colours indicate regions of relatively lower sensitivity. Sensitivity is good throughout most of the brain, except in the brainstem and interhemispheric fissure.

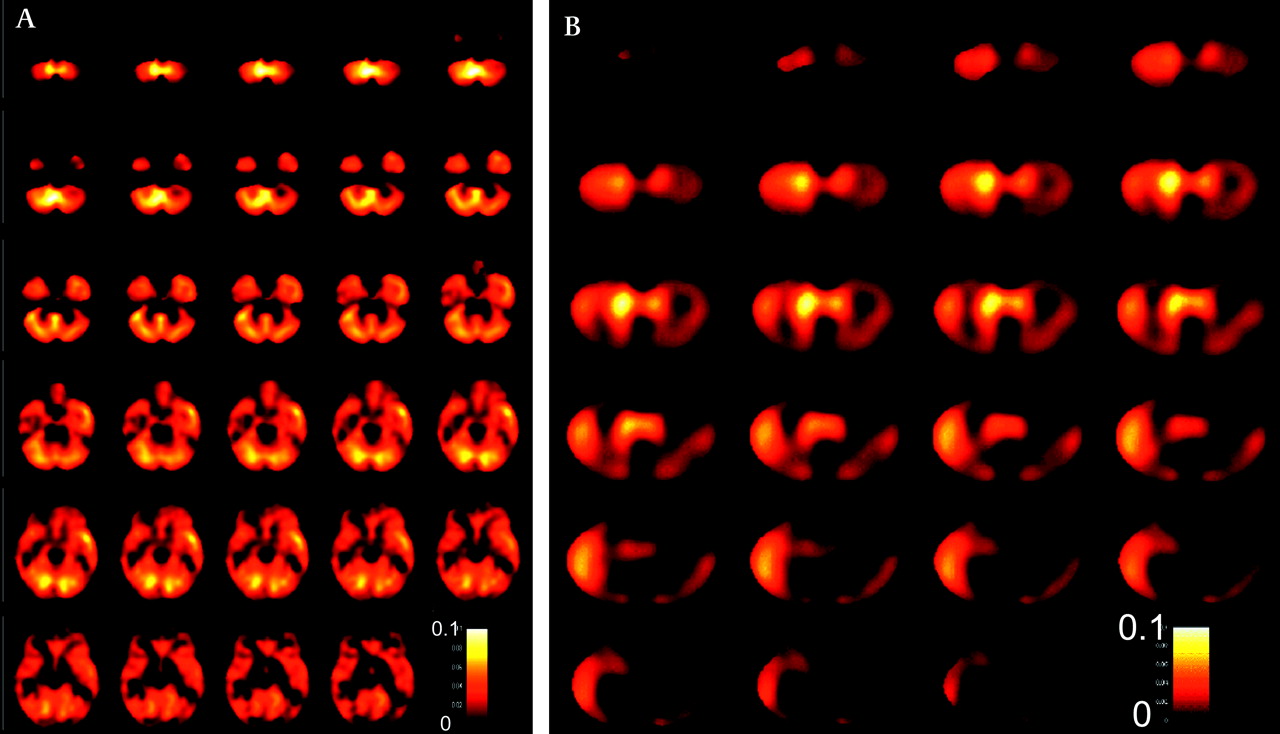
Size effect maps showing the magnitude of the differences in grey matter between controls and patients with obstructive sleep apnoea (OSA). (A) Whole brain analysis: changes from the base of the cerebellum (z=−60 mm) to a level immediately below the level of the anterior commissure (z=−4). (B) Cerebellum (SUIT) analysis. Each panel shows horizontal slices at 2 mm intervals. The colour scale indicates the size of the effects across the brain (hotter colours black to red to yellow to white indicate greater grey matter (fractional change in grey matter volume) in control versus OSA). These maps indicate larger changes in the right temporal cortex and in the left cerebellum; these changes are consistent with the patterns of statistical significance.
Discussion
Our study shows that regional grey matter loss does occur in patients with OSA. Using improved VBM analysis techniques in a relatively large dataset, we found a reduction in grey matter volume in the right temporal lobe and left cerebellum of patients with severe OSA. The functional consequences of these structural deficits remain to be determined.
Impact of different VBM analysis techniques on grey matter loss
Our findings are consistent with previous studies17 20 which reported grey matter loss in the temporal lobe and cerebellum of patients with OSA. However, our data do not confirm previous reports of grey matter changes in the frontal and parietal cortices, anterior cingulate or the hippocampus,17 18 20 areas important in autonomic regulation as well as cognitive function. The differences between the findings of the present study and those of previous studies cannot be explained by heterogeneity in sensitivity to detect reductions in grey matter volume in these regions. Our sensitivity map revealed relatively homogeneous sensitivity throughout most of the brain. The contradiction between the areas of grey matter volume reduction in our study and those of previous studies may therefore be explained by our use of improved image analysis techniques and appropriate statistical thresholds. It has been argued that the use of analysis thresholds that are too stringent will mask small differences in grey matter concentration between patients with OSA and controls.31 Nevertheless, some form of correction for multiple comparisons is required when using VBM techniques for whole brain comparisons to account for the very large number of voxels that make up the brain volume.19 29 Our level of inference differs from previous studies18 19 in that we controlled for topological FDR across the entire brain. We chose this statistical threshold because lenient uncorrected thresholds are usually considered appropriate only for exploratory analyses, voxel-level FDR suffers from ambiguity in interpretation and voxel-level FWE can be too stringent if correcting across all brain voxels. Topological FDR provides a more appropriate level of control for type I and II errors when investigating where regions of grey matter loss occur across the brain.25
It has also been suggested that the magnitude of the changes in grey matter volume that occur in patients with OSA are similar to those seen with ageing, and that apnoea-related changes may be missed if age is not included in an analysis of the covariance model.31 In both the present study and the previous study by O'Donoghue et al,19 age was included in the analysis of covariance, replicating this aspect of the analysis model of Macey et al.17 The use of the 12 mm smoothing kernel is also consistent across the present study and previous studies.17 18 20
Grey matter loss in the temporal lobe
The decreased grey matter volume observed in the right middle temporal gyrus in patients with OSA is consistent with previous reports.17 20 These studies also found reductions in grey matter in the inferior temporal gyrus, including the parahippocampal gyrus, and extending towards the anterior temporal pole.17 20 The precise function of the middle temporal gyrus is unclear. However, it is noteworthy that this area is susceptible to hypoxic damage in an animal model of OSA.16
Recent attempts to link the structural deficits in patients with OSA with functional consequences have concluded that structural deficits are associated with only minor memory and motor impairments.20 It would therefore appear that the structural deficits precede the functional consequences. Alternatively, only minor functional consequences may have been found if patients with OSA are able to compensate for structural deficits by increasing neuronal activation. Support for this suggestion is that brain activation is greater during verbal learning tasks performed by healthy people in a sleep-deprived state compared with a non-sleep deprived state32 and in patients with OSA compared with controls.9
Grey matter loss in the cerebellum
The whole brain analysis, controlling for topological FDR, suggested grey matter loss in a single large region of the cerebellum extending bilaterally but appearing to be more dominant on the left. As this was only a single region identified while controlling for topological FDR, it is difficult to be specific about the localisation of grey matter loss within the region. When thresholded at p<0.05 corrected for FWE across the whole brain, the only portion of the region that survived was on the left. The issues associated with analysis of MR images of the cerebellum have been previously noted.27 Accordingly, we carried out our additional analysis using the SUIT technique to confirm the region of change. The SUIT analysis showed that the dominant region of grey matter loss was indeed lateralised to a limited area in the left cerebellum (figure 2).
The notion that OSA leads to cerebellar damage is intriguing. The cerebellum has a broad range of functions. Patients with right focal lesions often show verbal deficits whereas those with lesions on the left appear to suffer from more spatial deficits.33 In particular, the left VIIIB location has been highlighted as being involved in motor processing.34 Moreover, the links between the cerebellum and prefrontal activation suggest that working memory tasks which require a quick shift of attention may be impaired.35 Finally, cerebellum activation is increased during simulated driving.36 We speculate that impairments in attention and working memory, in association with excessive daytime sleepiness, could have negative consequences for daily tasks carried out by patients with OSA and may in part explain the OSA-related increased risk of road traffic accidents.6 An alternative view is that neural deficits in the cerebellum may actually exacerbate or even cause sleep apnoea.37 Recent data which show a reduction in grey matter volume in the cerebellum of older people with previously undiagnosed sleep disordered breathing could support this idea38; whether such lesions precede the development of sleep apnoea is unknown.
Other imaging modalities
Other methods of MR analysis such as diffusion imaging enable early detection of structural changes in axons and their myelin sheaths. The axonal damage detected with diffusion MRI in the hippocampal, cerebellar and pontine neurons of patients with OSA may therefore occur before any reduction in grey matter is detectable with VBM.39 Reduced concentrations of N-acetylaspartate and choline in prefrontal white matter of patients with OSA compared with controls measured using magnetic resonance spectroscopy (MRS) would also support this idea of early structural (white matter) changes in patients with OSA.40 MRS changes have been found in the left hippocampus in a small number of patients with OSA compared with controls. Here the reduced creatine-containing compounds were correlated with OSA severity and cognitive impairment.41 These data suggest susceptibility of the hippocampal tissue to the intermittent hypoxia that occurs in OSA.
Limitations
A potential criticism of our study is that the acquisition of MR images on two different scanners introduces a source of variance that may interfere with our ability to detect OSA-specific grey matter changes. Previous studies from one of our centres42 43 have shown that differences between scanners can be adequately controlled by incorporating site as a covariate in the statistical model. Our study is also well balanced across sites, so the results from one site are unlikely to dominate our SPM findings. However, to investigate this issue further we generated low threshold maps (p<0.001) for both whole brain and cerebellum for each centre independently using SPM8 and a smoothing kernel of 12 mm. This analysis showed that all changes were evident to some degree at low thresholds (p<0.001 uncorrected) in both sets of data independently. The cerebellar changes were evident in both whole brain and dedicated cerebellum (at lenient thresholds) analysis.
It should be noted that the patients with OSA were heavier than the healthy controls and it is possible that neck fat may have degraded the MR scans at the level of the cerebellum. Studies in which the patients with OSA and controls are matched for BMI and neck size could test this issue, since the interrelationship between BMI and AHI makes it difficult to tease apart any effects statistically.
Conclusions
We found a reduction in grey matter volume in the right middle temporal gyrus and the left cerebellum in a large sample of patients with OSA compared with non-apnoeic healthy controls. These neural deficits could lead to impaired motor processing, divided attention tasks and working memory. We speculate that such deficits could, when linked with excessive daytime sleepiness, negatively affect everyday tasks such as driving.
Acknowledgments
Professor Rob Pierce died in tragic circumstances in the Victorian bushfires on 7 February 2009. His co-authors wish to dedicate this manuscript to his memory. We would like to thank Dr A K Simonds, Professor M I Polkey, Dr J Jamieson and Dr A R C Cummin for allowing us to recruit patients from their clinics.
References
Footnotes
Funding The study was funded by The Wellcome Trust, Hammersmith Hospitals Trust, The National Heart and Lung Institute Foundation, The Australian National Health and Medical Research Council, Austin Health Medical Research Foundation, the Operational Infrastructure Support Program of the State government of Victoria, Australia, and ResMed Australia. It was supported by the NIHR Respiratory Disease Biomedical Research Unit at the Royal Brompton and Harefield NHS Foundation Trust and Imperial College London.
Competing interests None.
Ethics approval This study was conducted with the approval of the Royal Brompton Hospital.
Provenance and peer review Not commissioned; externally peer reviewed.
Linked Articles
- Airwaves