Article Text

Abstract
Objectives Monitoring studies have shown that commuters are exposed to high air pollution concentrations, but there is limited evidence of associated health effects. We carried out a study to investigate the acute respiratory health effects of air pollution related to commuting by bicycle.
Methods Twelve healthy adults cycled a low- and a high-traffic intensity route during morning rush hour in Utrecht, The Netherlands. Exposure to traffic-related air pollution was characterised by measurements of PM10, soot and particle number. Before, directly after and 6 h after cycling we measured lung function (FEV1, FVC, PEF), exhaled NO (FENO) and respiratory symptoms. The association between post- minus pre-exposure difference in health effects and exposure during cycling was evaluated with linear regression models.
Results The average particle number concentration was 59% higher, while the average soot concentration was 39% higher on the high-traffic route than on the low-traffic route. There was no difference for PM10. Contrary to our hypothesis, associations between air pollution during cycling and lung function changes immediately after cycling were mostly positive. Six hours after cycling, associations between air pollution exposure and health were mostly negative for lung function changes and positive for changes in exhaled NO, although non-significant.
Conclusions We found substantial differences in ultrafine particle number and soot exposure between two urban cycling routes. Exposure to ultrafine particles and soot during cycling was weakly associated with increased exhaled NO, indicative of airway inflammation, and decrements in lung function 6 h after exposure. A limitation of the study was the relatively small sample size.
- Air pollution
- cycling
- exposure
- particle
- respiratory health effects
- epidemology
- respiratory
- exposure assessment
- transport
Statistics from Altmetric.com
- Air pollution
- cycling
- exposure
- particle
- respiratory health effects
- epidemology
- respiratory
- exposure assessment
- transport
Introduction
Air monitoring studies have shown that commuters are exposed to high air pollution concentrations.1–9 Commuter exposures are typically much higher than those measured at fixed site monitors because they are closer to the source.10 A recent WHO report indicates that in many countries people spend 1–1.5 h/day commuting.11 Despite this short travel time, studies have documented that time spent in traffic was a significant predictor of 24 h average personal exposure.12–14
There is limited evidence of health effects related to the short, high air pollution exposures during commuting. Evidence from epidemiological and toxicological studies indicates that traffic-related air pollution affects a number of health outcomes, including cardiorespiratory mortality, non-allergic respiratory morbidity, allergic illness and symptoms, cardiovascular morbidity and lung cancer.11 However, these studies assessed long-term average or 24 h average air pollution exposures. A few human controlled exposure studies have associated exposure to high concentrations of diesel exhaust with both systemic and pulmonary inflammatory responses, after exposure durations of 1 h15 16 or 2 h.17 18 An association between myocardial infarction and participation in traffic in the few hours before infarction onset has been reported in an observational study.19 A study among healthy young policemen20 suggested that 9 h work shift exposure to traffic-related PM2.5 may cause (patho)physiological changes including inflammation, coagulation and changes in heart rate variability. A study from London among subjects with asthma21 documented that 2 h exposure while walking near heavy diesel traffic was associated with changes in lung function, (neutrophilic) airway inflammation and airway acidification. These associations were mostly related to exposure to ultrafine particles and elemental carbon.
We carried out a study to investigate the health effects of exposure to traffic-related air pollution during everyday, routine commuting by bicycle in the city of Utrecht, The Netherlands.
Materials and methods
Study design
Twelve healthy non-smoking adults cycled for about 1 h on 16 days during morning rush hour (between 8:00 and 9:30 am) from the city centre of Utrecht, The Netherlands to Utrecht University campus. Participants were divided into two groups and cycled simultaneously on two routes: one was a low-traffic route leading through roads of low traffic intensity and green areas, while the other was a high-traffic route using major roads with significant car and bus traffic. On both routes a similar average speed was maintained, and the routes were of a similar length. Major sections of both routes were likely options for people commuting on a daily basis to the university campus. Sampling took place on 16 days in April and May 2007, from Mondays to Thursdays. The measurements of exposure to traffic-related air pollution were performed simultaneously on both routes using two measurement bicycles operated by technicians. Lung function, exhaled NO (a non-invasive marker of airway inflammation) and respiratory symptoms were measured before and after cycling. Exhaled NO was measured 6 h after exposure to allow time for the development of inflammation. Each participant cycled for a maximum of eight times. The association between post- minus pre-exposure differences in health and exposure during cycling was studied with linear regression models.
Participants
We recruited 12 participants among students and employees of Utrecht University via internal mailing lists. Exclusion criteria were smoking, the presence of asthma or chronic obstructive pulmonary disease and exposure to dusts, fumes and/or gases during work, obtained by a short screening questionnaire. The exclusion of occupationally exposed subjects was to minimise any bias in health testing 6 h after exposure. As we selected subjects who lived in the city centre, the time taken to reach the collection point by bicycle for pre-exposure testing was short, minimising pre-exposure to traffic-related air pollution. The average cycling time to reach the collection point was 9.5 min and varied between 2 and 20 min, while the average distance was 2.1 km, ranging from 0.9 to 3.3 km. All the subjects cycled to the campus on a regular basis, including the test days of the study.
The study was approved by the ethics committee at University Medical Center, Utrecht. Written informed consent was provided by all participants.
Cycling routes
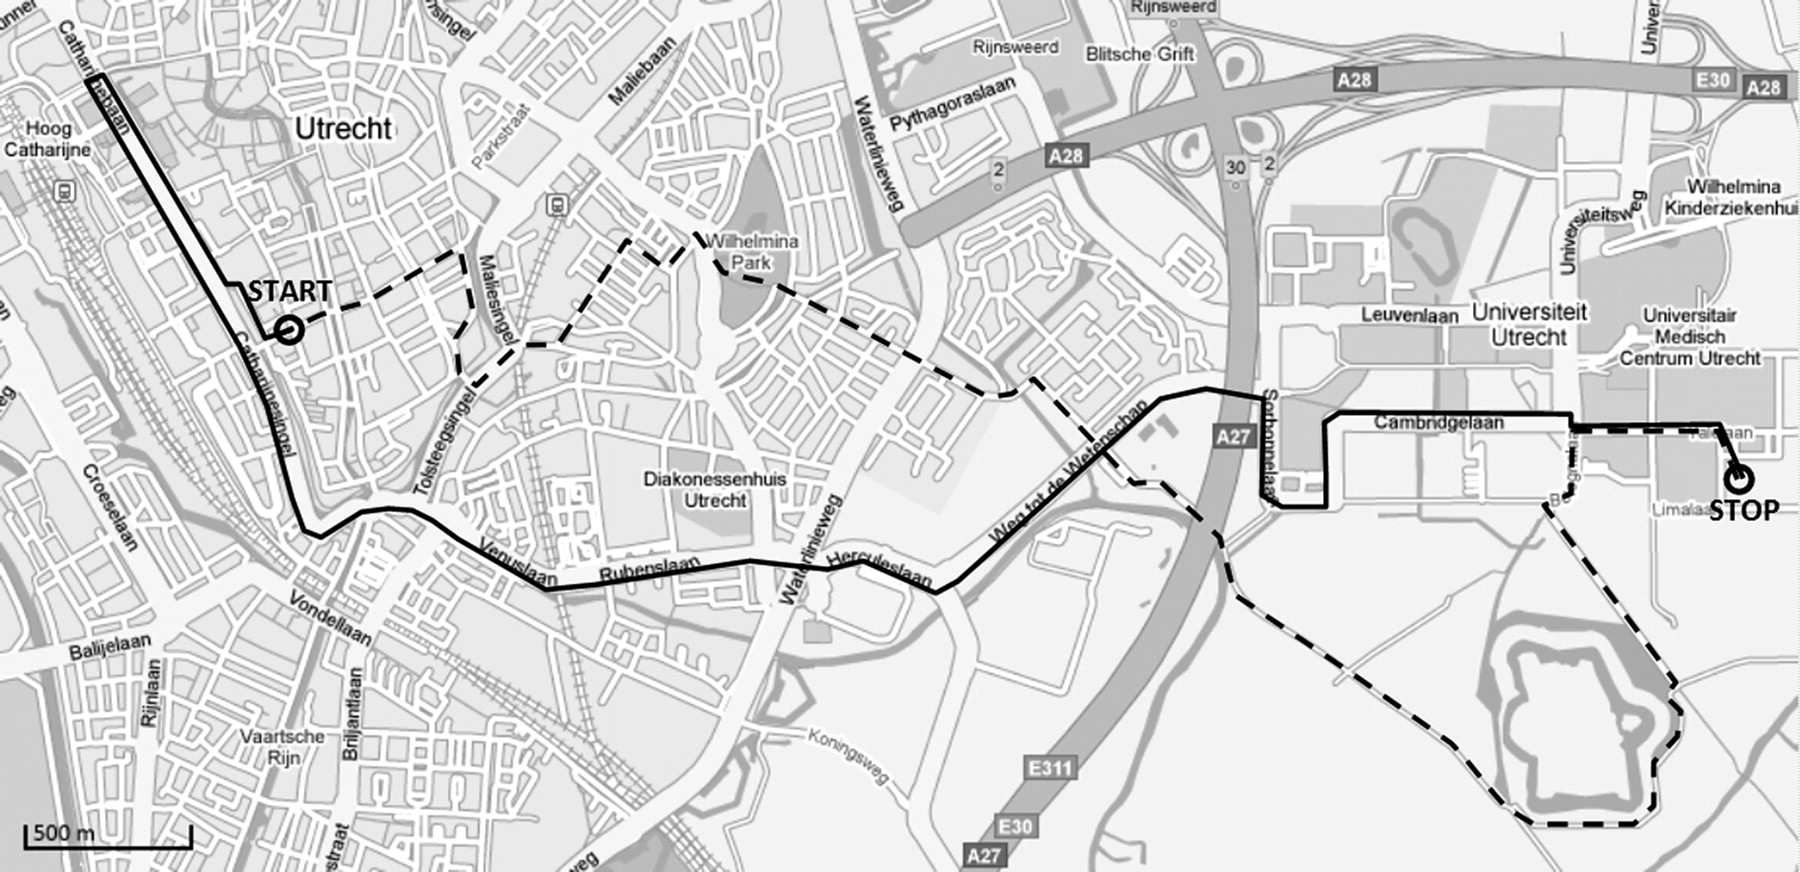
Figure 1 shows the low- and high-traffic routes. The low-traffic route (7.7 km) went through inner city Utrecht on small roads (traffic intensity less than 4500 vehicles per day) and cycle paths through green areas. The high-traffic route (8 km) was on major roads with high traffic intensity (10 000–30 000 vehicles a day). For most of the high-traffic route a cycle lane right beside the main road was used. Substantial parts of the high-traffic route included high bus traffic intensity (about 40 buses/h in both directions).

Map of the routes used in the study. The dashed line denotes the low-traffic route and the solid line the high-traffic route.
The aim was for each participant to cycle the low- and high-traffic route for the same number of test days. However, for logistic reasons, six participants did not cycle each route the same number of times, although the ratio of cycling one route to cycling the other was not less than 1:3.
Exposure measurements
We measured particle number concentration (PNC) with a real-time condensation particle counter (CPC model 3007; TSI, St Paul, MN). The CPC3007 measures particles ranging from 0.01 μm in diameter. One-second averages were stored. Two instruments were used, and the instrument readings were compared each measuring day. Before each sampling day a “zero” check was performed.
The concentration of particles less than 10 μm in aerodynamic diameter (PM10) was measured in duplicate with Harvard impactors.22 23 Two indoor pumps (model SP-280E; Air Diagnostics and Engineering, Harrison, ME) operating on a car battery were used to provide flows of 10 l/min. Elapsed-time indicators and flows measured with calibrated rotameters were used to calculate the sampled volumes. Particles were collected on Teflon filters (37 mm diameter, 2 μm pore size, PVC support ring; Pall, Port Washington, NY). To determine particle mass, filters were pre- and post-weighed in a climatised room using a Mettler MT5 microbalance (Mettler-Toledo, Greifensee, Switzerland) with 1 μg precision. After weighing, the soot concentration of all PM10 filters was measured using a Smoke Stain Reflectometer (model M43D; Diffusion Systems, London, UK) and reflectance values were transformed into absorbance.22 23 Various studies have shown that absorbance is a good surrogate for elemental carbon (soot).22 24 25 We use the term “soot” below.
Temperature and relative humidity during cycling were measured with an Oakton RH/TempLog datalogger (Oakton Instruments, Vernon Hills, IL). All sampling instruments were installed on two cargo bicycles operated by technicians with the subjects cycling close to the cargo bicycles.
For quality assurance/control, eight field blanks were taken. Mean field blank weight changes were subtracted from all sample weights.
Health measurements
Before each “commute”, the lung function and fractional exhaled nitric oxide (FENO) of the participants were measured and a short symptom questionnaire administered. Directly after exposure, the lung function test and the symptom questionnaire were repeated. Six hours after the commute, exhaled NO, lung function and symptoms were measured. Exhaled NO was not measured directly after exposure because the development of inflammation is probably not immediate. We selected 6 h after exposure because of previous studies which used a similar delay in the measurements of inflammatory response16 17 26 and because we wanted to limit other exposures to air pollution before the post measurement. All participants worked in indoor settings at the campus and were not required to travel much outside the area.
Lung function was measured with a handheld Micro Medical Diary Card electronic spirometer (Micro Medical, Rochester, UK). The instrument fulfils American Thoracic Society (ATS) requirements.27 Two spirometers were used, and six technicians operated them. Each participant performed at least two manoeuvres supervised by a technician. The best value from the technically correct manoeuvres was selected according to the “maximum value method” of the European Respiratory Society (ERS).28 Before pre-exposure measurements, three syringe checks (with a calibrated 1 l syringe) and two to three spirometric manoeuvres by the same field technician were recorded to monitor the performance of the device. The syringe check had to be within 5% of the mean value. The FVC and FEV1 of the technician had to be within 6% of the mean value and peak expiratory flow (PEF) had to be within 15% of the mean value of the technician.
The fraction of nitric oxide in exhaled air (FENO) was measured with a Niox Mino Monitor (Aerocrine, Solna, Sweden). The instrument complies with ATS/ERS recommendations.29 A scrubber in the instrument provides nitric oxide-free air during inhalation. Two instruments were used. The instrument was also used to measure the level of nitric oxide in ambient air in the room where the FENO measurement was performed.
Each participant filled in a symptom questionnaire, subjectively rating their respiratory symptoms (eg, cough, wheeze) on a 0 (no complaints) to 3 (severe complaints) scale.
At the beginning of the study each participant was asked to complete a baseline questionnaire based largely on the European Community Respiratory Health Survey.
Data analysis
We analysed the associations between air pollution during cycling and the difference in lung function and exhaled NO between the pre- and post-cycling measurements for each test day using linear regression. By using the difference in health parameters per subject per test day as the dependent variable, we accounted for between-subject variation of lung function and exhaled NO. We did not analyse the respiratory symptom diaries as there were very few reported changes in symptom status over the cycling periods.
As independent variables, we used PM10, soot, mean PNC, 99th percentile of PNC and type of route (low versus high traffic). The 99th percentile of PNC was evaluated since the mean PNC may not properly capture the highly variable exposure during commuting.
As potential confounders, we analysed temperature, relative humidity during cycling and ambient NO during FENO measurements. We also adjusted for possible technician and instrument effects.
Sensitivity analysis included an analysis of participants who did not report nasal allergies and an assessment of the impact of potential outliers (defined as studentised residual larger than two in absolute value) on the associations between air pollution and respiratory health. Mixed linear models were used to evaluate the influence of repeated observations per subject and sampling on consecutive days (using compound symmetry and first order autoregressive terms of the residuals).
All data analyses were carried out using SAS v 9.1 (SAS Institute, Cary, NC).
Results
Participants
A total of 80 observations were obtained from 12 participants (table 1). The participants had a mean age of 30 years. Three participants reported nasal allergy in the period of the study, and one reported being a former cigarette smoker.
Population characteristics (N=12)
Exposure measurements
The detection limit, calculated as three times the standard deviation of all four duplicate field blanks divided by the nominal sampling volume, was 14.51 μg/m3 for PM10 concentration and 0.664×10⁻⁵/m for soot concentration. All soot concentrations were above the detection limit, and we retained the value of the only PM10 sample below the detection limit. For two of the 16 sampling days, duplicate PM10 measurements did not meet the criteria (the difference in collected mass was more than 20 μg) and so were excluded. However, the absorbance measurements of these samples agreed well, suggesting that imprecision in weighing the small amounts of particles was the limiting factor. Remaining duplicates agreed within 16% on average.
PNC data for the first days were missing because prolonged vibration while cycling resulted in “tilt” messages indicating contamination of the optical detection system by fluid. This was solved by placing the CPC in a backpack carried by the technician riding the cargo bicycle. Data from one sampling day were missing because a CPC pump was blocked.
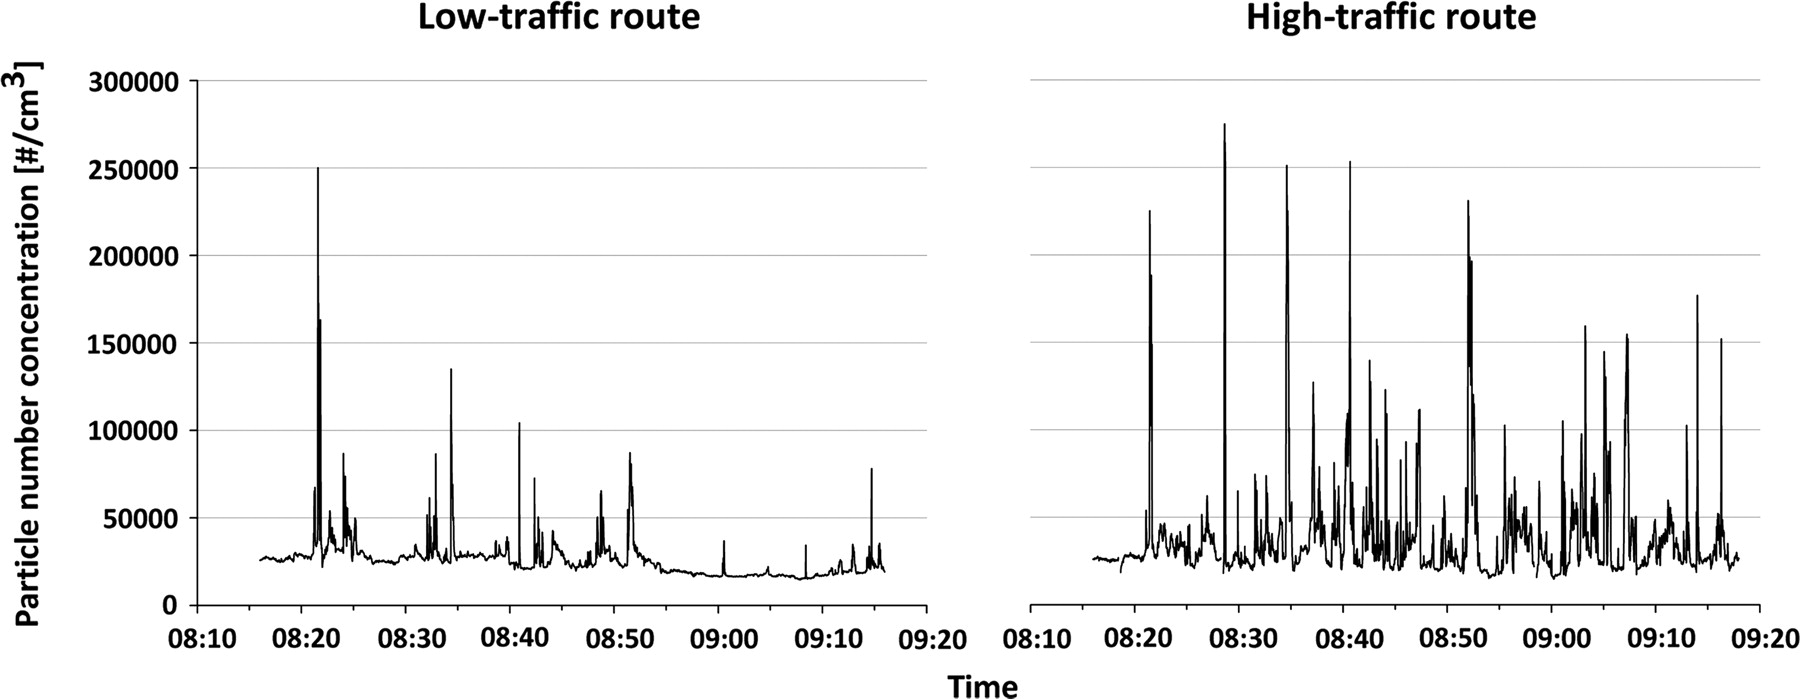
The average PNC was 59% higher on the high-traffic route compared to the low-traffic route (table 2). The average soot concentration was 39% higher on the high-traffic route; PM10 concentrations were similar between the two routes. The larger difference in PNC compared to soot concentration measurements between the two routes can partly be explained by differences in sampling time. Average PNC sampling time was 59±1 (mean±SD) min for the low-traffic route and 59±2 min for the high-traffic route. For PM10/soot, the sampling times were 95±7 and 93±7 min, respectively (pumps were turned on some time before exposure and left running after exposure indoors to allow flow reading). Hence, the soot contrast during cycling would have been higher. For the 59 min period coinciding with the PNC measurements, we calculated a soot contrast of 54%, assuming that 70% of soot penetrated indoors30 and using the soot concentration measured on the low-traffic route to represent concentrations at the background locations of the collection and end point. PNC was higher on the high-traffic route on each sampling day (figure 2C). Figure 2C also illustrates the high variability of PNC across sampling days over each route, which is probably related to weather conditions. Peaks of short duration occurred on both routes, likely related to passing high-emission vehicles (figure 3). The average PNC on the first 3 km of the high-traffic route was 52 095 particles/cm3, while on the final part of the route it was 33 113 particles/cm3. On the first section (3.5 km) of the low-traffic route, the average PNC was 32 559 particles/cm3, while on the final section it was 24 169 particles/cm3.
Distribution of air pollution exposures and weather conditions during cycling
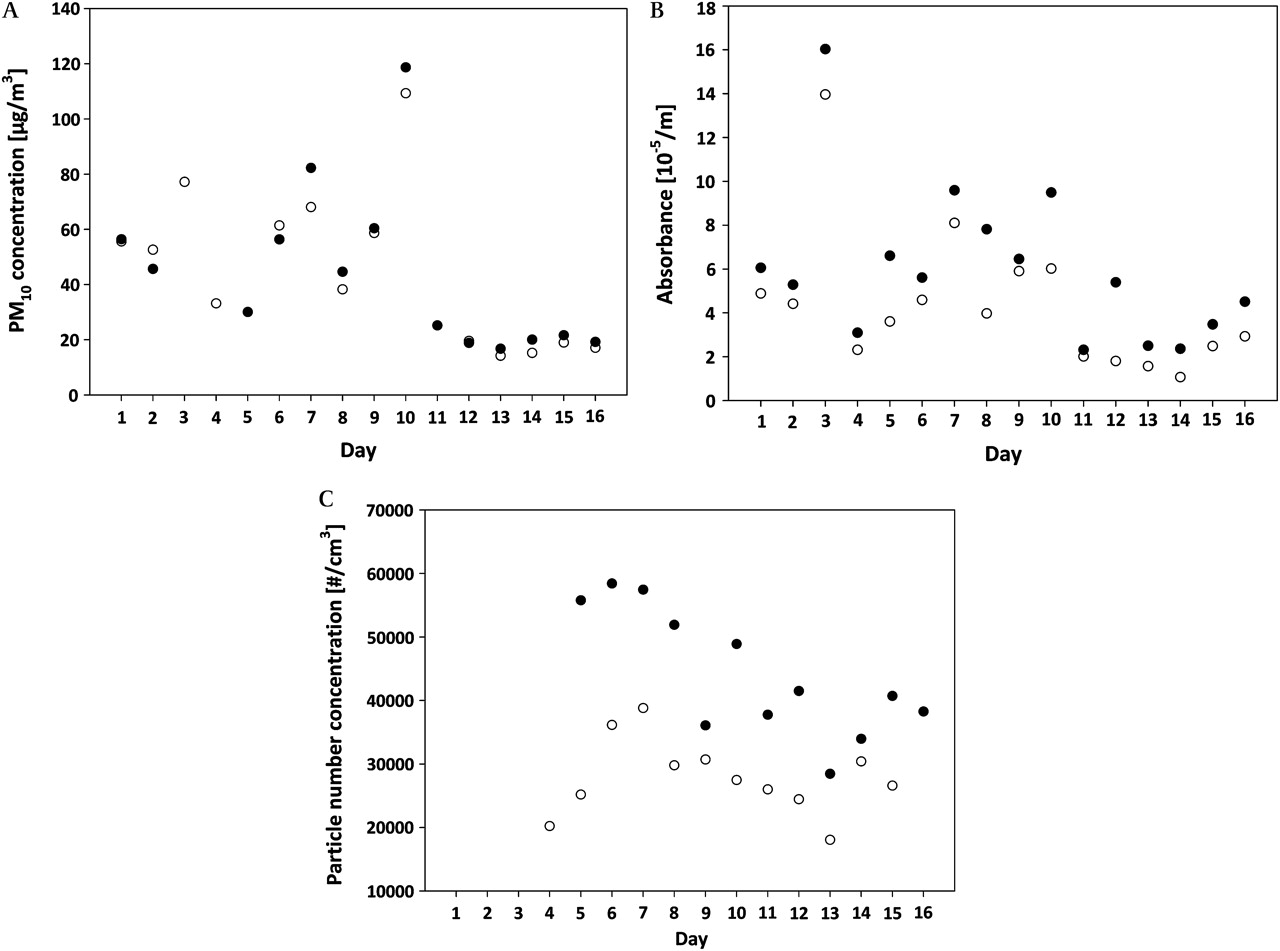
Average PM10 (A), soot (B) and particle number concentrations (C) for each type of route. Empty circles denote the low-traffic route, and filled symbols the high-traffic route.
Characteristic temporal variation (1 s averages) of particle number concentration while cycling along the high- and low-traffic routes on one of the sampling days.
Missing PM10 and PNC data occurred on different days for low- and high-traffic routes. When we restricted the analysis to valid measurements on both routes on same day, the contrasts in PM10 and PNC exposure changed slightly (6% and 57%, respectively).
The average temperature was the same on both routes, while relative humidity was about 2% higher on the low-traffic route.
Associations between air pollution and health
Immediately after cycling, air pollution was predominantly positively associated with the change (post minus pre) in lung function, although most of these associations were not statistically significant (table 3). Unadjusted and adjusted effect estimates were similar (data not shown).
Adjusted association between exposure to air pollution during cycling and percentage changes (post−pre) in lung function parameters and exhaled NO
However, 6 h after cycling, associations between air pollution and lung function were predominantly negative, although none were statistically significant. Associations between the traffic-related particle indicators and exhaled NO were positive, again without reaching statistical significance.
Before adjustment for confounders, there was a positive, borderline significant association (estimate±SD: 4.7±2.7, p=0.09) between mean PNC and levels of FENO. After adjusting for confounders, this association became slightly less significant and the effect estimate decreased slightly (table 3).
In the subgroup of nine subjects without nasal allergy, associations between exposure and changes in FENO were weaker (mean PNC effect estimate: 1.6±2.9 ppb, p=0.59). Associations between soot and PNC with lung function changes 6 h after cycling were somewhat stronger in this subgroup, for example, effect estimates for the association between soot and FVC, PEF and FEV1 were −129±61 ml (p=0.04), −262±166 ml/s (p=0.12) and −76±53 ml (p=0.15), respectively. For changes in lung function parameters immediately after cycling, the positive associations between PEF and mean PNC did not change.
After removing three to six influential observations (RSTUDENT>|2|; see Materials and methods section) the association between changes in FENO and mean PNC became slightly more significant (p=0.07), while the effect estimate decreased slightly (3.4±1.8 ppb). Six hours after cycling, associations between soot and mean PNC with lung function changes were slightly stronger, for example, effect estimates for soot with FVC and PEF became −93±55 ml (p=0.09) and −274±127 ml/s (p=0.03), respectively. The positive associations immediately after cycling were not affected.
When type of route was used as an independent variable, no significant associations were found.
Point estimate and confidence intervals describing the associations between exposure and health were unaffected in mixed models taking into account clustering within subjects and sampling on consecutive days.
There were no consistent differences in associations between subjects travelling more than the median distance to the collection point and those travelling less than the median distance. The associations of mean PNC with the exhaled NO at 6 h after exposure were stronger in the below median group (13.2±4.9 vs −2.3±4.5), but the lung function decrements were less (FVC: 105±139 vs −193±70).
Discussion
We carried out a study to assess particulate matter air pollution exposures and potential respiratory health effects related to cycling along routes of different traffic intensity. The largest contrast in exposure related to route occurred for PNC and soot, with no contrast for PM10. Associations between air pollution exposure during cycling and lung function changes immediately after cycling were mostly positive, contrary to our hypothesis. However, 6 h after cycling, associations of air pollution exposure during cycling were mostly negative for lung function changes and positive for exhaled NO, although without reaching statistical significance.
Exposure contrasts
The current study adds to the evidence that proximity to traffic is much better reflected by contrasts in particle number or soot (elemental carbon) concentrations than in PM10 concentrations, as reported in studies at fixed sites at short distances from major roads31–33 and studies monitoring in-traffic exposures.24 34 Average ultrafine particle concentrations on the high-traffic route were comparable to measurements in cyclists in central Copenhagen (geometric mean 32 400 particles/cm3) and Vancouver (range 18 830–57 692 particles/cm3).13 34 A study among cyclists on one of the busiest streets in London found substantially higher PNCs (mean 93 968 particles/cm3).9 Differences between studies in average commuting exposure may be related to the weather conditions during the typically short sampling campaigns, the route selected (traffic intensity and street configuration), the distance between the cyclist and motorised traffic, and urban background concentrations. In our study, 72% of the high-traffic route had separate cycling lanes within 5 m of the road edge, 22% had separate cycling lanes further than 5 m, and 6% of the route was cycled on less busy roads.
The contrast we found for PNC and soot was smaller than the exposure contrast of pedestrians between Oxford Street and Hyde Park in London, probably related to source (high diesel vehicle intensity) and the street (canyon) characteristics of Oxford Street.21 In the study in London, absolute PNC levels were much higher, but the contrast between routes was very similar to our study.9 The higher absolute levels are probably due to higher traffic intensities of the sampling routes and possibly a lower sampling height.
The contrast we found in exposure between two largely realistic routes suggests that people can influence their exposure substantially by choosing a route with less busy roads. This is consistent with the cyclist monitoring study in Vancouver which showed substantial contrasts in PNC related to the proximity of the cyclist to motorised traffic34 and with a modelling study in Copenhagen.35
Exposure during cycling is characterised by large short-term variability of concentrations, probably related to emissions from individual vehicles. Commuting exposures thus differ from controlled exposure studies in which subjects are exposed to more constant, though on average higher, concentrations of diesel exhaust.
Associations between air pollution exposure and health
We did not find negative associations between exposure and changes in lung function parameters immediately after cycling. This is consistent with the results from most chamber studies.16–18 The positive association between PNC and changes in PEF could not be explained by confounding, influential observations or nasal allergy of subjects.
Six hours after cycling, FEV1 and FVC were decreased and FENO was increased in association with soot and PNC, although none of the associations were statistically significant. The weak positive association we observed between FENO and PNC is broadly consistent with two observational studies in elderly subjects26 and people with asthma.21 In our study, a increase in PNC of 40 000 particles/cm3 was associated with a 15% increase in FENO. In the Oxford Street study an approximately 4.8% increase in exhaled NO was found for the same increase in PNC exposure. Stronger and more significant effects were found related to elemental carbon in the Oxford Street study.21 In a study among elderly adults, black carbon exposures involving a 2 h bus trip were associated with an increase in post-trip exhaled NO concentrations.26 Two controlled exposure studies in healthy subjects found an inflammatory response after exposure to 200–300 μg/m3 of diesel exhaust during 1 h of intermittent exercise16 and 2 h at rest.17 These concentrations are about 50 times higher than the soot concentrations in our study.
A 15×10−5/m increase in soot in our study was associated with a 1–4.5% decrease in all measured lung function parameters 6 h after cycling, very similar to the decrements found in the Oxford Street study.21 In that study the differences in lung function were found immediately after exposure and remained until 7 h after exposure. The Oxford Street study was performed in subjects with asthma who are probably more sensitive. In addition, the study population was larger. Our results thus add to a small database of studies that suggest that short-term exposures during traffic participation may affect respiratory health. The clinical importance of our findings in healthy adults is not clear.
Compared with our design, experimental (chamber) studies were carried out at much higher concentrations ranging from 100 to 300 μg/m3 PM10, and PNC from 1.2×10⁶ to 4.3×10⁶ particles/cm3, and some of them were of a longer duration. Additionally, in experimental studies diesel exhaust exposure was investigated while in our study exposure to a more complex mixture of traffic-related air pollutants occurred. Experimental studies involved stable concentrations to which the subjects were exposed, while in our study a strong variation in the exposure levels (peaks) was found.
Limitations of our study include a relatively small sample size and a slow speed of cycling (about 8 km/h). A higher speed was difficult to attain when cycling on the cargo bicycle fully loaded with the monitoring instruments. Because of the low speed, exercise levels and hence inhaled pollution doses were lower than during normal cycling. As pollen data for the city of Utrecht were not available, we accounted for the potential confounding effect of pollen by performing a stratified analysis of subjects with and without nasal allergy. This analysis did not show significant differences between the subgroups. We acknowledge that the diagnosis of nasal allergy/hay fever by questionnaire is a limitation.
To conclude, we found a substantial contrast in ultrafine particle number and soot exposure between two cycling routes in the city of Utrecht. Exposure to ultrafine particles and soot during cycling was weakly associated with an increase in exhaled NO, indicative of airway inflammation, and decrements in lung function 6 h after exposure.
What this paper adds
Air monitoring studies have shown that commuters are exposed to high air pollution concentrations.
There is limited evidence of health effects related to the short, high air pollution exposures during commuting.
Cyclists can substantially decrease their exposure to ultrafine particles and soot by choosing a route with less busy roads.
Short-term exposure to ultrafine particles and soot in traffic may increase airway inflammation and reduce lung function 6 h after exposure.
Our study adds to the evidence that more attention to the health effects of air pollution exposure during traffic participation is necessary.
Acknowledgments
The authors would like to thank Nanja Willers and Marloes Eeftens for their help with data collection, as well as the personnel of the Bartholomeus Gasthuis in Utrecht for kindly facilitating the pre-exposure health measurements.
References
Footnotes
The work was performed at the Institute for Risk Assessment Sciences, Division of Environmental Epidemiology, Utrecht University, PO Box 80178, 3508 TD Utrecht, The Netherlands.
Competing interests None.
Ethics approval This study was conducted with the approval of the METC, UMC Utrecht, The Netherlands.
Provenance and peer review Not commissioned; externally peer reviewed.