Article Text

Abstract
BACKGROUND The low attenuation areas on computed tomographic (CT) scans have been reported to represent emphysematous changes of the lung. However, the regional distribution of emphysema between the inner and outer segments of the lung has not been adequately studied. In this study the regional distribution of low attenuation areas has been compared by quantitative CT analysis and the contribution of the regional distribution to pulmonary function tests evaluated in patients with chronic obstructive pulmonary disease (COPD).
METHODS Chest CT images and the results of pulmonary function tests were obtained from 73 patients with COPD. The lung images were divided into inner and outer segments in the upper (cranial), middle, and lower (caudal) sections. The percentage ratio of low attenuation area to corresponding lung area (LAA%) was then calculated. The LAA% of each segment was also compared with the results of pulmonary function tests.
RESULTS The mean (SD) LAA% of the inner segment was 39.1 (18.5) compared with 28.1 (13.2) for the outer segment (p<0.0001). Linear and multiple regression analyses revealed that airflow limitation is closely correlated with the inner segment LAA% of the lower lung. In contrast, the carbon monoxide transfer factor is closely correlated with the inner segment LAA% of the upper lung.
CONCLUSION Low attenuation areas on CT scans are more often found in the inner segment of the lung than in the outer segment, and the contribution of the inner segment to pulmonary function tests may be greater than the outer segment.
- emphysema
- regional distribution
- computed tomography
Statistics from Altmetric.com
Computed tomography (CT) of the chest has been reported to reflect the histological structure of the lung accurately and to be useful in the diagnosis and evaluation of various kinds of pulmonary parenchymal diseases.1 As for the analysis of CT images, a quantitative method using digital data as well as a visual assessment of the scan is currently available.2-19 In patients with chronic obstructive pulmonary disease (COPD), the low attenuation areas (LAAs) on CT scans in vivo have been reported to represent macroscopic and microscopic emphysematous changes of the lung.2-7 ,17
Some lung diseases, such as usual interstitial pneumonitis and silicosis, have a well defined pattern of disease distribution.20 Surgical specimens and CT scans give the impression that pulmonary emphysema is predominantly located in the subpleural regions. However, it has been reported that emphysematous lesions are situated in the central part of the lung while the outer portion has a normal appearance.3
The present study used high resolution CT scanning to quantify the regional distribution of LAAs in the inner and outer segments of the lung and to examine their effects on pulmonary function tests in patients with COPD.
Methods
SUBJECTS
The study was approved by the ethics committee of Kyoto University and was performed on 73 men with COPD. They all underwent pulmonary function tests and CT scans, and a diagnosis of COPD was made according to the criteria of the American Thoracic Society.21
PULMONARY FUNCTION TESTS
Pulmonary function tests were performed with a Chestac-65V® (Chest MI Corporation, Tokyo, Japan) on the same day as the CT scans were taken. The following parameters were measured: vital capacity (VC), forced vital capacity (FVC), forced expiratory volume in one second (FEV1), residual volume (RV) using the helium dilution method, and carbon monoxide transfer factor (Tlco) using the single breath method.
CT SCANS
The CT scans were taken in the supine position using a high resolution CT scanner (X-Vigor®; Toshiba, Tokyo, Japan) with 2 mm collimation, scanning time of 1.0 s, 120 kV electrical voltage, 250 mA electrical current, and 32 cm field of view (FOV). A high resolution reconstruction algorithm for the lung (FC83®; Toshiba, Tokyo, Japan) was employed. During scanning the patients were asked to hold their breath after a deep inspiration. No contrast medium was injected.
Three sections from each patient were analysed. A upper (cranial) section was obtained 1 cm above the superior margin of the aortic arch, a middle section was taken at 1 cm below the carina, and a lower (caudal) section was taken at 3 cm above the top of the diaphragm.8 ,10 Each CT image was composed of 512 × 512 matrices with numerical data (CT numbers) in Hounsfield units (HU). These CT data were transferred to a PowerPC 604e personal computer via a magneto-optical disk and analysed with an original analysis program written in C programming language (Symantec C++®, Symantec Corporation, California, USA).
Briefly, the following steps were carried out automatically during the analysis. The lung parenchyma, defined as those areas with CT numbers less than –200 HU,9 was detected automatically.8 ,15 ,16 The trachea, major bronchus, and vessels at the hilum were then excluded.10 After separating the right and left lung,9 ,10 the outer segment was automatically defined as the peripheral lung comprising 50% of the lung area, and the remaining area was defined as the inner segment. This division was chosen to avoid the difficulty in making the separation on anatomical grounds and to facilitate the correlation with lung function tests. The boundary line between the inner and outer segments was determined as follows: (1) distance to the lung surface was the same from any point along the boundary line, and (2) the area of the outer segment was 50% of the lung area. The original CT image, the lung parenchymal image, and the outer segment image of a representative case are shown in fig 1.

Representative CT images of the lung. (A) Original CT image of the middle section, (B) lung parenchymal image, and (C) the outer segment image of the right lung. The computer assisted automated method successfully detected the lung parenchyma, excluded the trachea and major bronchus at the hilum, separated the right and left lungs, and divided the lung into inner and outer segments.
Using the previously reported method8 ,10 with minor modifications, the percentage ratio of LAA to the corresponding lung area (LAA%) was calculated automatically. The cut off level between the normal lung density area and the LAA was defined as –960 HU.8 ,10 ,15 Since the areas of the right and left lungs were not the same, the LAA% of each segment was averaged in proportion to the area of the right and left lungs.
The average LAA% of the three sections in total (T-LAA%), the LAA% of the upper, middle, and lower sections (U-LAA%, M-LAA% and L-LAA%, respectively), the average LAA% of the inner and outer segments of the three sections in total (T-i-LAA% and T-o-LAA%), and the LAA% of the inner and outer segments of the upper, middle, and lower sections (U-i-LAA%, U-o-LAA%, M-i-LAA%, M-o-LAA%, L-i-LAA% and L-o-LAA%, respectively) were calculated. All the processes were successfully performed.
ANALYSIS OF DATA
All of the data were expressed as means (SD). A one way analysis of variance (ANOVA) was performed to examine the significance of the differences between the sections and Wilcoxon’s signed rank test was used to compare the differences in the LAA% between the various segments. Correlation between the LAA% and the pulmonary function tests was evaluated by linear regression analysis. A p value <0.05 was considered to be statistically significant. A backward stepwise multiple regression method was used to analyse the relationship between the pulmonary function tests and LAA%. AnF value of >4.0 was considered to be statistically significant in the stepwise analysis. Stat View® (Abacus Concepts Inc, Berkeley, California, USA) software was used for all of the statistical analyses.
Results
All of the patients were men and were either current (n = 21) or ex-smokers (n = 52). They showed fixed airflow obstruction defined as an FEV1/FVC ratio of <70% without response to bronchodilators. None of the patients had large bullae nor other lung diseases. There were no patients with panacinar emphysema. The age, smoking history, pulmonary function data, T-LAA%, U-LAA%, M-LAA%, and L-LAA% of the patients are summarised in table 1. Hyperinflation, airflow limitation, and decreased transfer factor were noted. The U-LAA% was significantly larger than the M-LAA% (p<0.05).
Patient characteristics and LAA% in 73 patients with COPD
The T-i-LAA% was significantly larger than the T-o-LAA%, and the i-LAA% of each section was also significantly larger than each o-LAA% (table 2).
Mean (SD) LAA% of each lung site in 73 patients with COPD
The correlation coefficients (r values) between the pulmonary function tests and the T-LAA%, T-i-LAA%, and T-o-LAA% are shown in table 3. The LAA% correlated positively with the TLC and RV/TLC, and negatively with the FEV1, FEV1/FVC, and Tlco/VA. In contrast, the LAA% did not correlate with the VC.
Correlation coefficients (r values) between the LAA% and pulmonary function tests in 73 patients with COPD
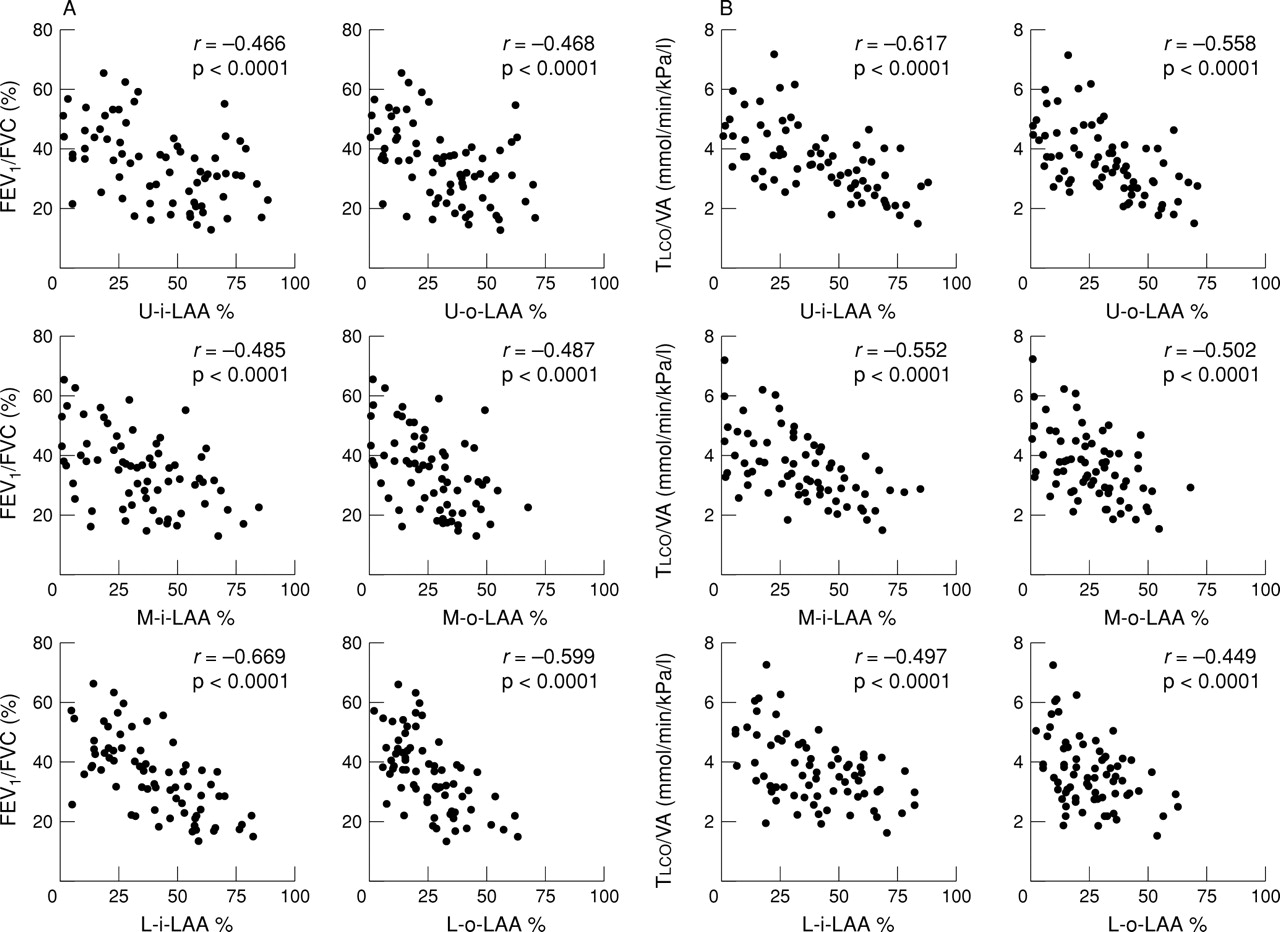
Figure 2 shows the relationship between the lung function parameters (FEV1/FVC and Tlco/VA) and the i-LAA% and o-LAA% of each section. A significant correlation between the LAA% and lung function was seen in all the sections and segments. Moreover, there was a tendency for the correlation coefficients for FEV1/FVC to be larger in the lower sections of the lungs and for Tlco/VA to be larger in the upper sections of the lungs. To evaluate this relationship in further detail, the backward stepwise multiple regression method was used for the i-LAA% and o-LAA% of each section. From this analysis a set of L-i-LAA%, U-o-LAA%, and U-i-LAA% values were the strongest predictors of FEV1/FVC (r 2 = 0.535, F = 46.1, 10.2, and 5.6, respectively), whereas Tlco/VA was mainly affected by a set of U-i-LAA% and L-i-LAA% data (r 2 = 0.424,F = 21.6 and 5.3, respectively).
Relationship between (A) the LAA% of each segment and FEV1/FVC and (B) the LAA% of each site and Tlco/VA in 73 patients with COPD. There was a significant negative correlation in each relationship (p<0.0001). LAA% = percentage ratio of low attenuation area to the lung area; U = upper lung; M = middle lung; L = lower lung; i = inner segment; o = outer segment.
Discussion
There has been an increased awareness of LAAs on CT scans in the evaluation of the severity of pulmonary emphysema since lung volume reduction surgery came into clinical practice.14 It has become more important to analyse the regional distribution of these LAAs because the surgeon cannot resect the inner lung, leaving the outer lung intact.
In the present study we have shown that the LAAs were found more often in the inner segment of the lung than in the outer. Although the middle section would include the minor fissure, analysis of M-LAA% showed the same result as the U-LAA% and L-LAA%. Since the LAAs on the CT scan represent pathological changes of pulmonary emphysema,2-7our findings indicate that emphysematous lesions occur more often in the inner segment of the lung than in the outer.
CT SCANS
We calculated the average LAA% using three sections to minimise the radiation dose. In an earlier study of 59 patients with COPD we found good linear correlation between the LAA% of 10 sections from the apex to the bottom of the lung and that of the three sections used in the present study (y = 1.004x—0.951, r= 0.991).
We used –960 HU as the cut off level between the normal lung density area and LAA. In previous reports the cut off level has varied from –900 to –960 HU. Bae and coworkers14 used –900 HU but other authors have used –910 HU,3 ,11-13–950 HU,4 ,5 ,17 and –960 HU.8 ,10 ,15This discrepancy may be due to differences between the CT machines which have different kinds of reconstruction algorithm, or to differences between conventional and high resolution CT scanning. In our preliminary study of eight healthy volunteers using the same high resolution CT machine as in the present study the mean minus 1 SD of mean lung density was –957 HU.
In the present study we asked the patients to hold their breath after a deep inspiration. Gevenois and colleagues17 reported that expiratory CT scans are not as accurate as inspiratory CT scans for quantifying pulmonary emphysema. However, Knudson and coworkers18 reported that the CT scan taken at full expiration can reveal emphysema. We therefore made another measurement of LAA% in eight patients with COPD who were asked to hold their breath after a deep expiration in the supine position. The result of this measurement was the same as that described in the present study. The mean (SD) T-i-LAA% at expiration was 37.8 (21.9) and the T-o-LAA% at expiration was 29.8 (14.3); this difference was significant (p = 0.036). The i-LAA% of each section was also significantly larger than o-LAA% at expiration.
INFLUENCE OF GRAVITY
The CT numbers are influenced by gravity but Millar and Denison22 reported that the vertical gradient of lung density was less at TLC than at RV in healthy supine men. In addition, it has been reported that the vertical gradient of lung density in patients with emphysema is less than that of normal healthy men, even at RV.23 We therefore assumed that the vertical gradient of lung density in patients with emphysema at TLC would be small. Since the patients in the present study were asked to hold their breath after a deep inspiration, the CT numbers must have been obtained close to TLC when the influence of the pleural pressure gradient is minimised. Moreover, if the effect of the vertical gradient on the CT numbers is linear it should not affect the results, and it has indeed been found by Millar and Denison to be nearly linear.23
Data from eight patients with COPD, scanned in both the supine and prone positions, showed that the i-LAA% was significantly larger than the o-LAA% (table 4). Thus, while we cannot discount the effect of gravity, we believe that the inner segment has more LAAs than the outer segment.
Mean (SD) LAA% of eight patients with COPD in both the supine and prone positions
DISTRIBUTION OF LOW ATTENUATION AREAS
To our knowledge, only Honma et al 19 have analysed the pathological distribution of centrilobular emphysema. Pathological emphysema was found to occur more in the inner layer of the lung than in the outer layer. These authors also evaluated the regional distribution of LAAs on high resolution CT scans by visual assessment and found that the LAAs in the outer layer accounted for a significantly lower ratio of the lung parenchyma than did those in the inner layer,19 which is similar to our finding.
There is no explanation for the finding that the LAAs occurred more often in the inner segment than in the outer. However, the following factors may help to explain this result: (1) deposition of inhaled agents occurs initially in the outer lung and the particles then move to the inner lung24; (2) blood contains many kinds of chemical substances which may affect the lung, and Hakimet al 25 found that the stratified distribution of pulmonary blood perfusion was greater in the inner lung than in the outer; (3) the lymphatic system clears both extravascular fluid and foreign particles reaching the alveolar spaces. The outer lung is close to the pleura which has many lymphatic vessels and to numerous interlobular septa which contain many lymph vessels.26 The ventilatory movement causes lymph to flow from the outer to the inner lung.27
CORRELATION WITH PULMONARY FUNCTION
Our finding that the T-LAA% was correlated with pulmonary function (table 3) is in agreement with the results of a number of other investigators who employed various indices of emphysematous changes using CT scans.5 ,7 ,8 ,11-14 ,17 ,18 The more frequent occurrence of LAAs in the upper lung (table 1) is compatible with the fact that the patients in the present study were suffering from centrilobular emphysema.8 ,14 ,21 ,28
Closer correlation does not always reflect a causal relationship. However, when the values of the correlation coefficients (fig 2) are considered in combination with the results of the multiple regression analysis, the FEV1/FVC is highly affected by the L-i-LAA% while the U-i-LAA% has a greater effect on Tlco/VA than on the other parameters. Multiple regression analysis also showed that the predictors of pulmonary function were all i-LAA% except for the U-o-LAA%. All the correlation coefficients between the T-i-LAA% and pulmonary function parameters were larger than those between the T-o-LAA% and pulmonary function except RV/TLC (table 3). Thus, the i-LAA% may be more important than the o-LAA% when considering the relationship between the LAAs and results of pulmonary function tests.
Lamers and coworkers11 reported that the pixel index, which is substantially the same as the LAA%, correlated better with the Tlco in the upper lung than in the lower lung, which is in agreement with our results. Gurney and colleagues12studied the correlation between the emphysema score on high resolution CT scanning and pulmonary function tests in randomly selected smokers. They found that the subjective emphysema score correlated better with the Tlco in the lower lung than in the upper lung, whereas in the upper lung the emphysema score had a better correlation with parameters of airway obstruction. These results contradict our present findings. The main reason for this discrepancy may be differences in the subjects selected. Although Gurney et alchose smoking volunteers, the subjects in our study had clinically defined COPD and were more severely impaired.
However, the reports mentioned above did not take the spatial distribution (inner or outer) of the LAAs into account. Haraguchi and colleagues29 studied the spatial distribution and found that emphysematous changes of the inner lung rather than the outer lung affected pulmonary function, which is in agreement with our results. However, they used mean CT density, which may not represent the pathological changes of emphysema, and manually selected regions of interest (ROI) to evaluate the CT density may be influenced by the non-homogeneous distribution of emphysema. The LAA% used in this study has been related to the pathological changes of pulmonary emphysema2-5 ,7 ,17 and is based on the total lung area measured by a newly developed computer assisted method.
The finding that the FEV1/FVC is highly affected by the L-i-LAA% can be explained as follows. The regional RV/TLC has been reported to be minimal in the lower lung.30 Since the RV is defined as the TLC minus the VC, the contribution of the lower lung to the FEV1 and FVC may be larger. The larger area of the lower lung and the movement of the diaphragm may also contribute to the FEV1 and FEV1/FVC. The inner segment had a greater LAA%, and thus may be more responsible for the airflow limitations derived from the emphysematous lesions. The finding thatTlco/VA is mainly affected by the U-i-LAA% could be explained by its larger LAA% which correlates well with the transfer factor.8 ,11-14 ,17 ,18
We conclude that low attenuation areas on the CT scan are situated more often in the inner segment of the lung than in the outer segment. The contribution of the inner segments to pulmonary function may be larger than the outer segment. Little is known about the natural history of pulmonary emphysema. High resolution CT scanning can detect the detail of the lung in vivo.1 The findings of this study provide a new viewpoint for evaluating pulmonary emphysema. It is likely that the studies on the regional distribution of LAAs will reveal some of the factors that underlie the pathogenesis of the disease.
Acknowledgments
The authors thank Dr H Itoh for useful suggestions and Dr K Morimune for statistical advice. They also thank Drs J C Hogg and H O Coxson for revising the manuscript, and Mr R Tanaka, Mr H Akazawa, Mr N Narai and Ms M Morimoto for technical assistance with the CT scans.